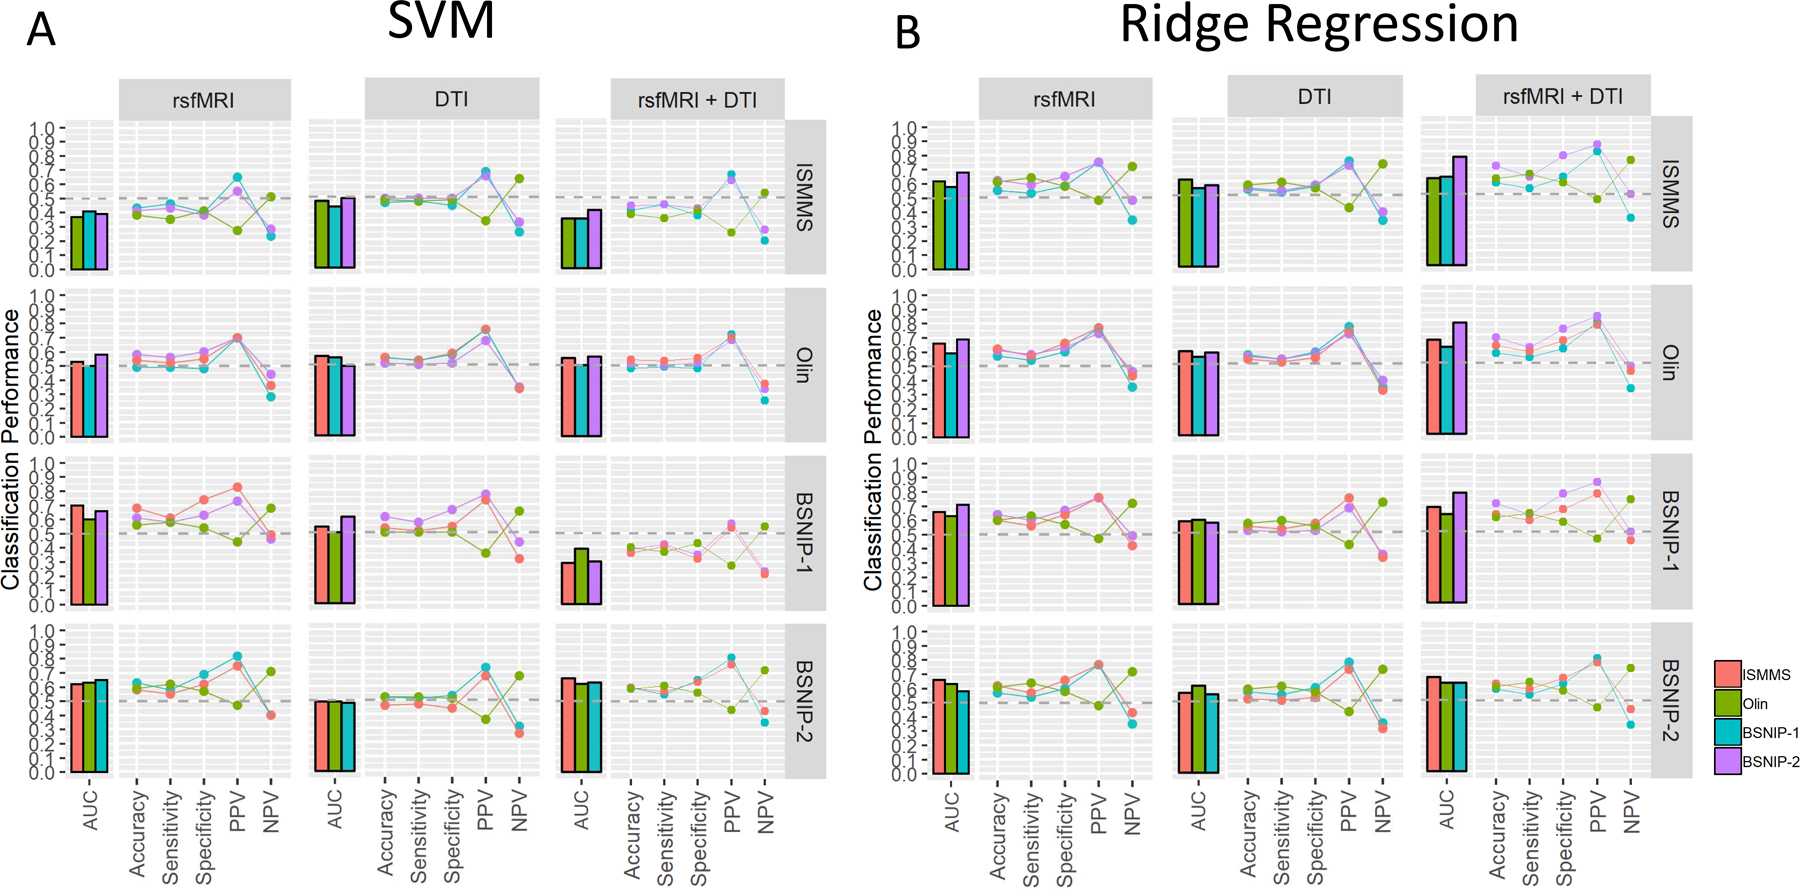
Figure 3. Between Sample Classification Results: Non-Residualized Features.

A. SVM performance profiles for between-sample sample classification for each feature modality (columns) when each sample is used as the training sample (rows). Each bar and line within a panel represents an independent testing sample for each training sample (n=3). Values are for models using non-residualized features; results for models using residualized features are shown in Supplementary Figure 7A and are largely similar B. Same as A but for the ridge regression algorithm. Again, models using residualized features are similar and shown in Supplementary Figure 7B. rsfMRI=resting state functional MRI, DTI=Diffusion Tensor Imaging, PPV=Positive Predictive Value, NPV=Negative Predictive Value, AUC=Area Under the Curve.
