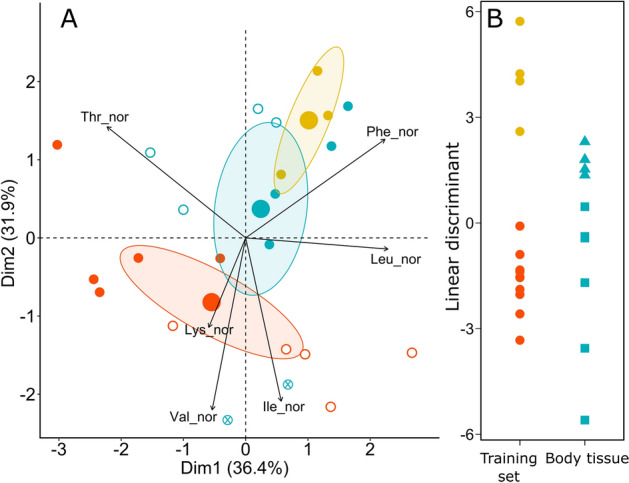
Figure 2.

(A) Principal component analysis (PCA) using normalized δ13C values of essential amino acids (δ13CEAA) in surface sediments (yellow), gut contents (red) and body tissue (blue) of O. mutabilis (filled symbols), E. rostrata (open symbols), and body tissue of S. globosa (circled cross). Ellipses outline the 95% confidence region around the mean (large symbols) for each group. (B) Linear Discriminant Analysis (LDA) based on a training set built with δ13CEAA values of surface sediments (yellow) and gut contents (red). Body tissue samples (blue) were collected in the period of low food supply (i.e. May; squares) and in the period of high food supply (i.e. October; triangles).
