Figure 3.
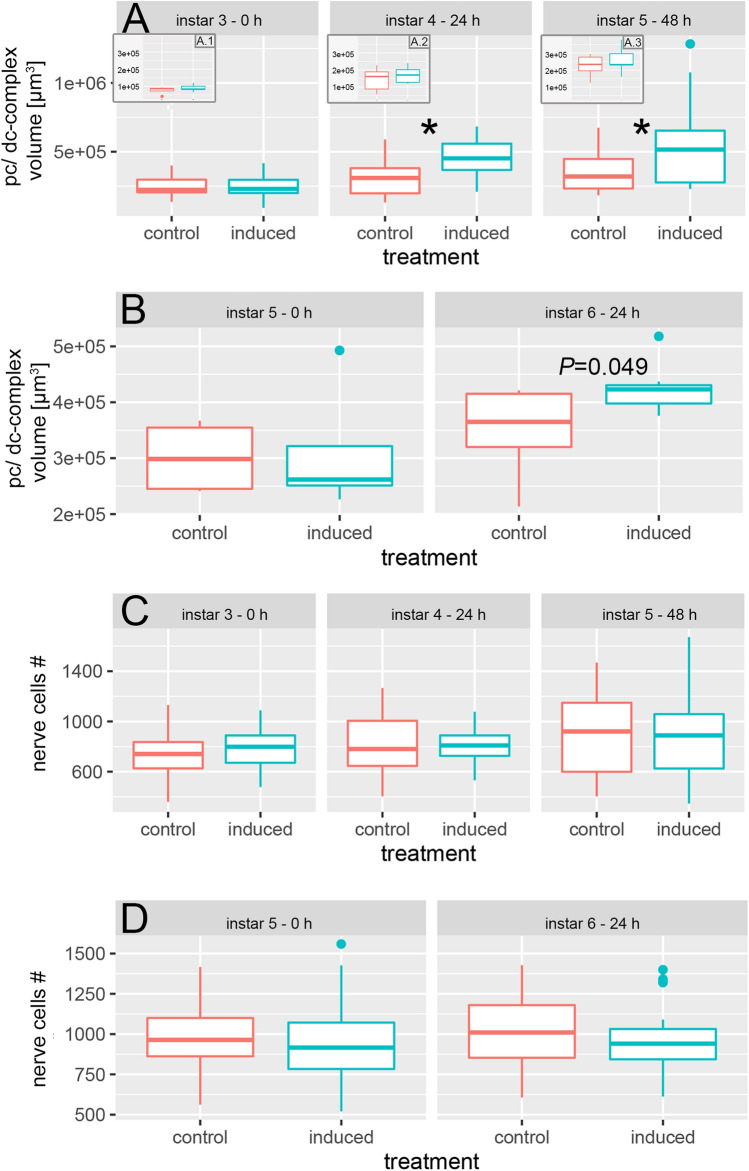
Structural plasticity underlying morphological defense expression (A) 24 h predator exposure starting from the 3rd instar, significantly induced an increase in pc/dc-complex volume compared to the controls (P = 0.011; t = 2.73; df = 28). This increase was also observed after 48 h predator-exposure (P = 0.014; t = − 2.59; df = 33). (A.1, A.2, A.3). We detected no significant differences in OG volume between treatments. We observed a significant increase in OG volume between instar 3 and instar 5 in both treatments (control ANOVA: F(2;13) = 9.63 P = 0.003 Tukey: P = 0.002; induced ANOVA: F(2;14) = 12.07 P = 0.001 Tukey: P ≤ 0.001). Alpha corrected levels of significance: * P ≤ 0.017; (B) When exposed to predators from the 5th instar onwards, the pc/dc-complex volume shows a tendency towards an increase after 24 h predator exposure compared to the control (P = 0.049; t = − 2.19; df = 12) and to the 5th instar (P = 0.036; t = − 2.42; df = 10) Alpha corrected levels of significance: *P ≤ 0.025. (C) We detected no significant differences in nerve cell numbers between treatments. We found a tendency towards an increased nerve cell number in naïve individuals in the 5th instar compared to the 3rd instar, when the animals were exposed to predators from the 3rd instar onwards (ANOVA: F(2;98) = 2.64 P = 0.077 Tukey: P = 0.076) Alpha corrected levels of significance: * P ≤ 0.025. (D) When exposed to predators from the 5th instar onwards, we find no differences in nerve cell numbers between treatments or instars. Alpha corrected levels of significance: *P ≤ 0.017.

