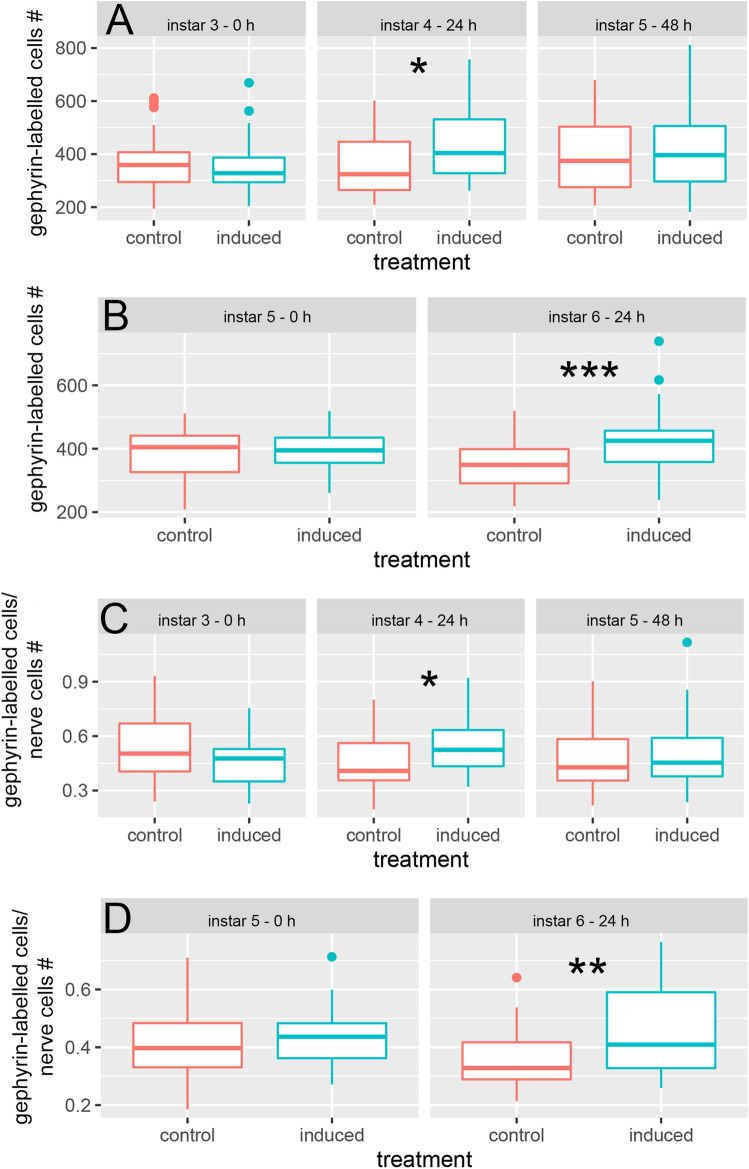
Figure 5.
Functional plasticity underlying morphological defense expression. (A) When exposed to predators from the 3rd instar onwards, the number of gephyrin-labelled cells is significantly increased after 24 h predator-exposure compared to the control (P = 0.013; t = − 2.56; df = 57) and to the 3rd instar (ANOVA: F(2;97) = 3.12 P = 0.049 Tukey: P = 0.039). (B) When exposed to predators from the 5th instar onwards, the number of gephyrin-labelled cells is significantly increased after 24 h predator exposure compared to the control (P ≤ 0.001; t = − 3.63; df = 44). (C) The number of gephyrin-labelled cells per nerve cells is significantly increased compared to the control after 24 h predator exposure, when the animals were exposed to predators from the 3rd instar onwards (P = 0.011; t = − 2.65; df = 57). (D) When exposed to predators from the 5th instar, the ratio of gephyrin-labelled cells/nerve cells is significantly increased compared to the control after 24 h predator exposure (P ≤ 0.001; t = − 3.41; df = 44). (A, C) Alpha corrected levels of significance: *P ≤ 0.017. (B, D) Alpha corrected levels of significance: **P ≤ 0.005; ***P ≤ 0.0005. Boxplots show median (middle line), 25th to 75th percentiles (box) and whiskers show highest and lowest value within 1.5× the interquartile range (1.5× below the 25th percentile and 1.5× above the 75th percentile), respectively. Dots indicate outliers > 1.5× the interquartile range.

