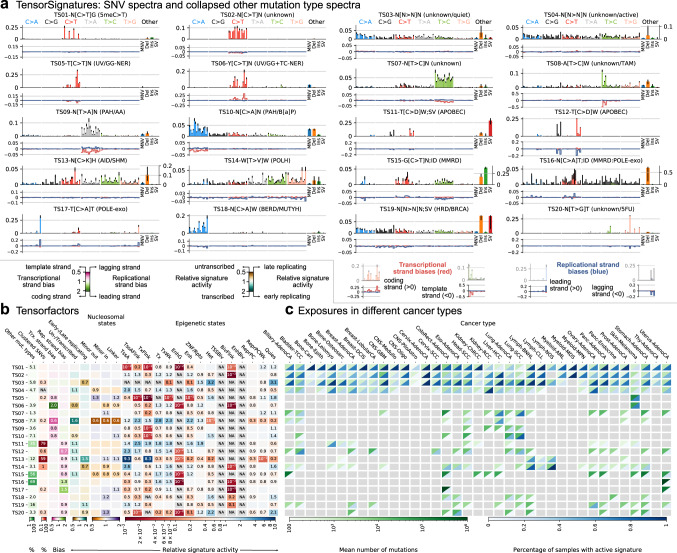
Fig. 2. Applying TensorSignatures on 2778 whole genomes from the ICCG PCAWG consortium revealed 20 tensor signatures and their genomic properties.
a Upper panels depict SNV spectra, and a summarised representation of associated other mutation types (error bars determine 95% bootstrap confidence intervals). SNV mutations are shown according to the conventional 96 single base substitution classification based on mutation type in a pyrimidine context (blue C > A, black C > G, red C > T, green T > A, grey T > C, salmon T > G) and 5' and 3' flanking bases (in alphabetical order). The panel under each SNV spectrum indicates transcriptional (red), and replicational strand biases (blue) for each mutation type, in which negative deviations indicate a higher probability for template or lagging strand pyrimidine mutations, and positive amplitudes a larger likelihood for coding or lagging strand pyrimidine mutations (and vice versa for purine mutations). b Heatmap visualisation of extracted tensor factors describing the genomic properties of each tensor signature. Proportions of other mutation types and clustered SNVs are indicated in percentages. Transcriptional and replicational strand biases indicate shifts in the distribution of pyrimidine mutations on coding/template and leading/lagging strand. Coefficients < 1 (pink) indicate signature enrichment on template or lagging strand DNA, and conversely values > 1 (green), a larger mutational burden on coding or leading strand (a value of 1 indicates no transcriptional or replicational bias). Relative signature activities in transcribed/untranscribed and early/late replicating regions. Coefficients > 1 (turquoise) indicate enrichment in transcribed and early replicating regions, while values < 1 (brown) indicate a stronger activity of the mutational process in untranscribed or late replicating regions. Relative signature activities on nucleosomes and linker regions, and across epigenetic states as defined by consensus ChromHMM states. Scores indicate relative signature activity in comparison to genomic baseline activity. A value of 1 means no increase or decrease of a signature’s activity in the particular genomic state, while values > 1 indicate a higher, and values < 1 imply a decreased activity. c Signature activity in different cancer types (Exposures). Upper triangles (green) indicate the mean number of mutations contributed by each signature, lower triangles show the percentage of samples with a detectable signal of signature defined as the number of mutations attributed to the signature falling into a signature-specific typical range (Methods). Greyed boxes indicate cancer types for which a signature was not found to contribute meaningfully. Source data are provided as a Source Data file.

