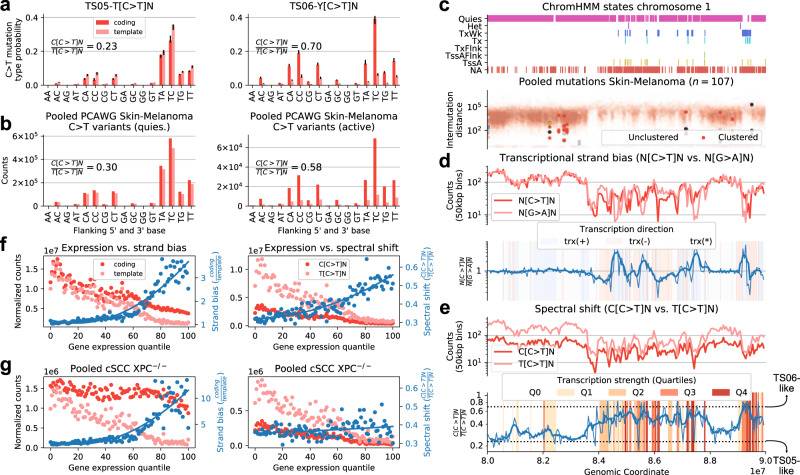
Fig. 4. The spectrum of UV mutagenesis changes from open to closed chromatin.
a C > T mutation probabilities of TensorSignatures TS05 and TS06 for coding and template strand DNA (error bars determine 95% bootstrap confidence intervals). b Pooled PCAWG Skin-Melanoma C > T variant counts from coding and template strand DNA in epigenetically active (TssA, TssAFlnk, TxFlnk, Tx and TxWk, right) and quiescent regions (Het and Quies, left). c Consensus ChromHMM states from a representative 10 Mbp region on chromosome 1, and the corresponding mutational density of pooled Skin-Melanoma samples. d N[C > T]N and N[G > A]N counts in 50 kbp bins, and their respective ratios (thin blue line: ratio; thick blue line: rolling average over 5 consecutive bins) illustrate the transcriptional strand bias of C > T mutations in quiescent and active regions of the genome. e Relationship between expression strength and the spectral shift of C > T mutations in terms of binned C > T variant counts in TpC and CpC context and their respective ratios (thin blue line) as well as a rolling average (thick blue line). f Gene expression strength vs. transcriptional strand bias (measured by the ratio normalised C > T variants in Skin-Melanoma on coding and template strand), and gene expression strength vs. C[C > T]/T[C > T] spectral shift (indicated as the ratio of normalise C > T mutations in 5'C and 5'T context). g Transcriptional strand bias and C[C > T]/T[C > T] spectral shift in GG-NER deficient XPC−/− cSCC genomes. Blue curves: quadratic fit. Source data are provided as a Source Data file.

