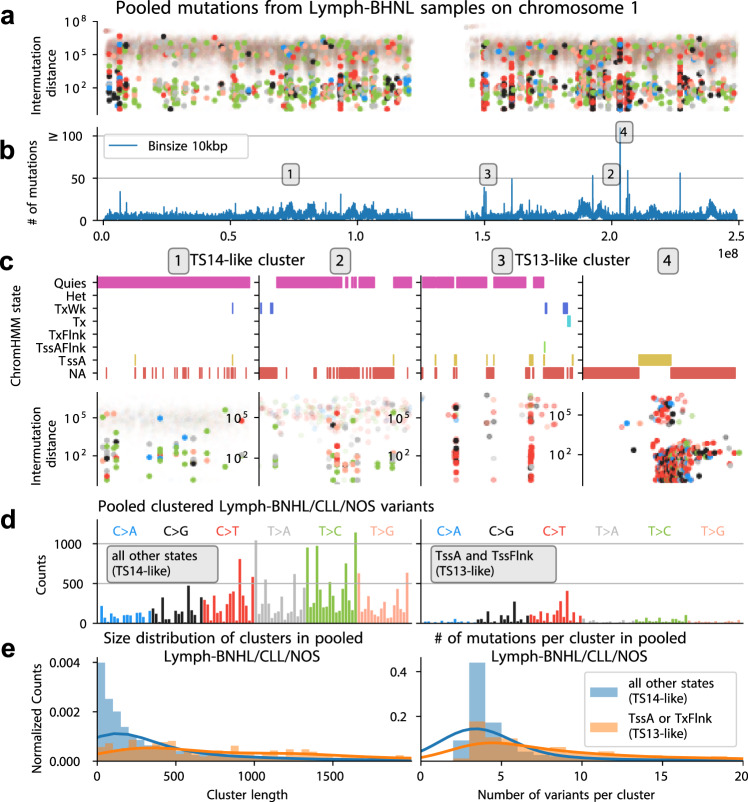
Fig. 7. Identification of a highly clustered mutational signature at active TSS.
a Rainfall plot of pooled variants from Lymph-BHNL samples on chromosome 1 (highlighted dots indicate clustered mutations). b Binned (10 kb) SNV counts of chromosome 1. Numbers 1-4 indicate mutation hotspots. c Consensus ChromHMM states and rainfall plots at mutation hotspots. d Pooled clustered variants from PCAWG Lymph-BHNL/CLL/NOS samples from TssA or TxFlnk (TS13-like), and all other epigenetic states (TS14-like). e Size distribution of mutation clusters (consecutive clustered mutations), and the distribution of number of variants per mutation cluster in TS13 and TS14 high samples respectively. Source data are provided as a Source Data file.

