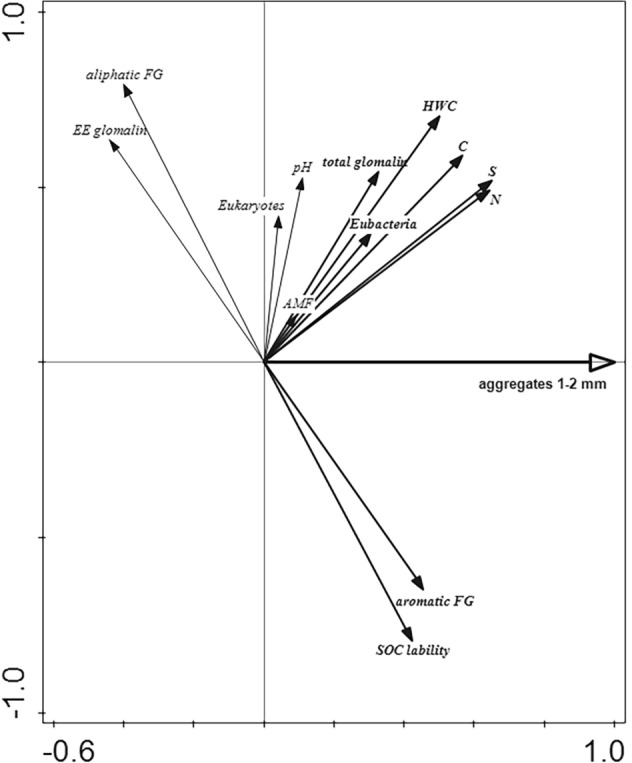
Figure 2.

Ordination diagram showing results of redundancy analysis testing how well variation in the assessed soil parameters could be explained by the stability of 1–2 mm soil aggregates. Soil parameters positively and significantly (p < 0.05) associated with the predictor are shown in bold. Angle between predictor arrow and particular soil parameter arrow approximates linear correlation between the two variables (proportional to the cosine of the angle). The first (horizontal) axis explains 18.3% of the total variation in soil parameters. AMF, arbuscular mycorrhizal fungi; FG, functional groups; HWC, hot water extractable carbon; EE glomalin, easily extractable glomalins; SOC lability, soil organic carbon lability.
