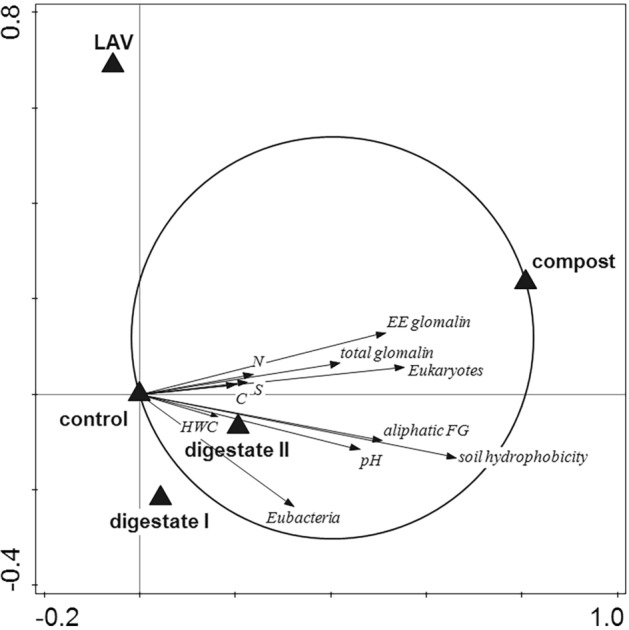
Figure 3.

T-value biplot for the relationships between the soil parameters and the compost application. The arrows fully falling within a Van Dobben circle indicate a significant positive (P < 0.05) relationship between a soil parameter and the predictor. Soil parameters located outside the circles are not displayed, although they were included in the analysis. Functional groups (FG); hot water extractable carbon (HWC); easily extractable glomalins (EE glomalin); SOC (soil organic carbon) lability.
