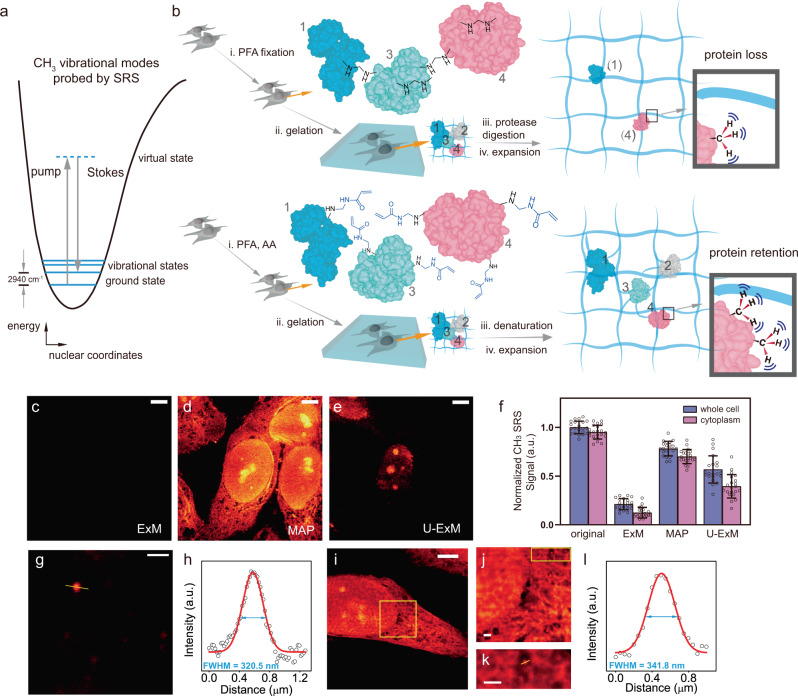
Fig. 1. High-resolution label-free vibrational imaging of expanded and protein-retained samples.
a Energy scheme for SRS probing of CH3 vibrational motion at 2940 cm−1. More details in Supplementary Fig. 1. b Comparison of protein retention (i.e., the methyl groups, CH3, from proteins) for SRS imaging between ExM (top) and MAP (bottom) based sample-hydrogel embedding procedures following different fixation, hybridization, and homogenization chemistries. c–e SRS imaging of CH3 at 2940 cm−1 for expanded HeLa cells following ExM, MAP, and U-ExM sample treatment under the same intensity scale. Scale bars: 20 μm. f Quantification of protein retention levels by comparing average CH3 signals in expanded cells after ExM, MAP, and U-ExM procedures with that from unprocessed HeLa cells (original). CH3 signals in expanded cells were scaled back with the average expansion ratios for comparison. n = 21 cells examined over 3 independent experiments. Data are shown as mean ± SD. g, h Quantification of SRS resolution by imaging the C–H vibration at 3050 cm−1 from a representative 100 nm polystyrene bead (g) and fitting its cross-section profile (h). Scale bar: 1 μm. i–l Fitted VISTA imaging cross-section profile (l) from a small structural feature (k) of expanded HeLa cells (i–k, j, k are zoom-in views from the boxed regions in (i, j), respectively). Scale bars: 30 μm in (i), 2 μm in (j, k). For processed samples, the length scale is in terms of distance after expansion. Arbitrary units were used in (f, h, l) (abbreviated as a.u.).

