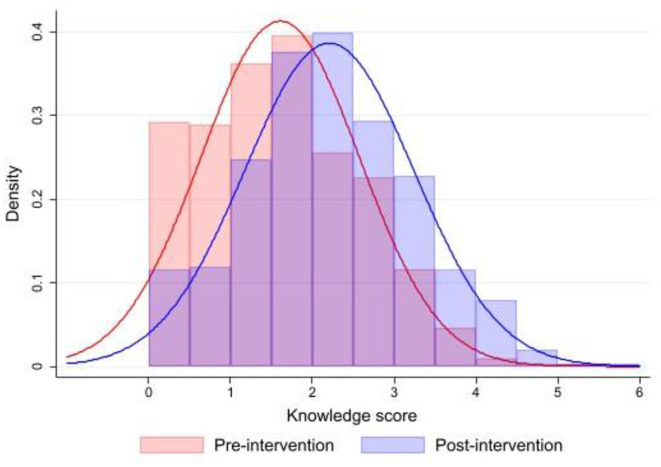
Figure 2.

Histograms of pre-intervention (N = 602; April 2020) and post-intervention (N = 606; December 2020) vitamin D-related knowledge in the study sample. The horizontal (x) scale uses the vitamin D-related knowledge score units, while the respondent's knowledge distribution is represented by the vertical bars (Red color line depicts normal Gaussian distribution of pre-intervention knowledge score, while blue color line depicts normal Gaussian distribution of post-intervention knowledge score).
