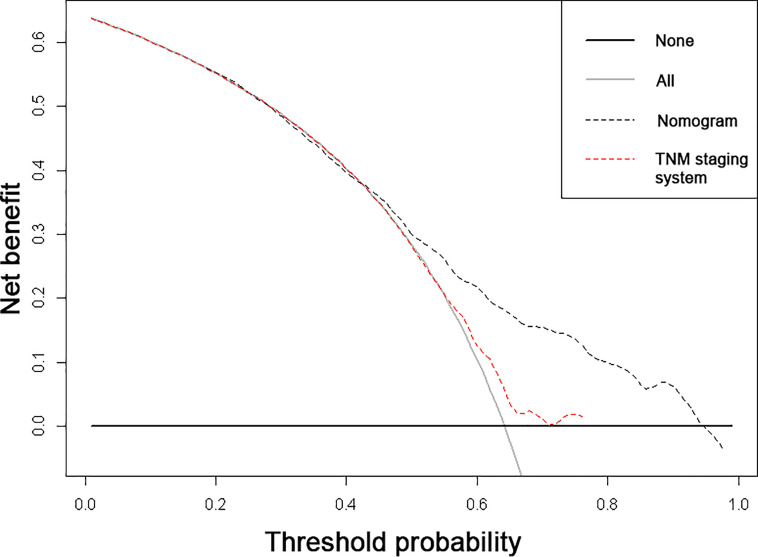
Figure 4.
Decision curve analyses (DCA) of the nomogram and 7th edition AJCC-TNM staging system for 3-year overall survival. The x-axis represents the threshold probabilities, and the y-axis measures the net benefits. The horizontal line parallel to the axis shows that overall death occurred in no patients, while the solid grey line demonstrates that all patients will have overall death at a specific threshold probability. The black and red dashed line represents the nomogram and 7th edition AJCC-TNM staging system, respectively.

