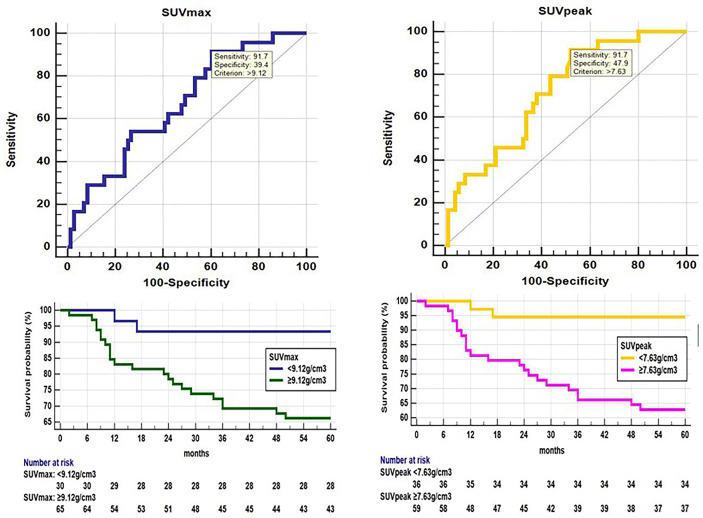
Figure 2.
ROC analysis shows that SUVmax(AUC 0.668, 95% confidence interval (CI) 0.564-0.761, p=0.006) and SUVpeak (AUC 0.716, 95% CI 0.615-0.804, p<0.001) had a positive effect on disease progression. The optimal cut-off threshold values for SUVmax and SUVpeak were 9.12 g/cm3 (sensitivity 91.67, specificity 39.44), 7.63 g/cm3 (sensitivity 91.67, specificity 47.89), respectively. Kaplan-Meier survival graph shows significantly different PFS between the groups categorized by SUVmax and SUVpeak above and below cut-off value (p<0.05, log-rank test).

