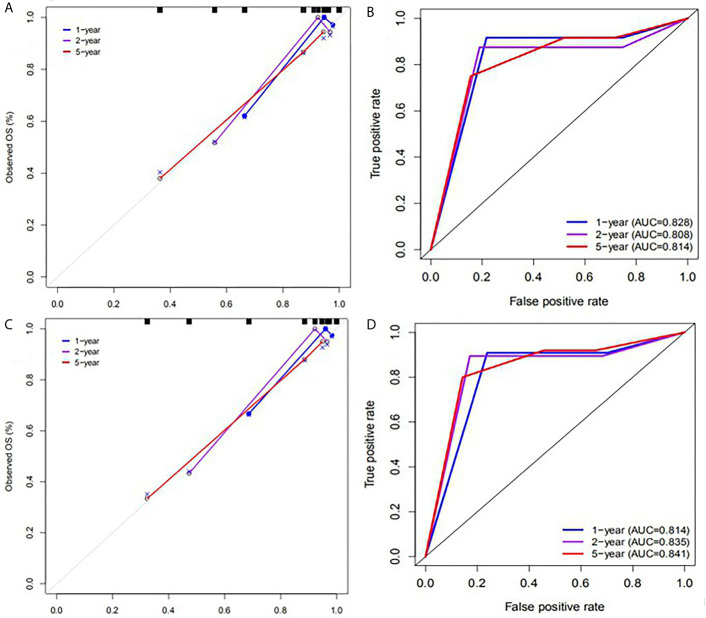
Figure 4.
Calibration plots and ROC curves for predicting PFS at 1-, 2-, and 5- year points. (A) The calibration plots for predicting PFS in the original model. (B) ROC curves of the nomogram for predicting PFS in the original model. (C) The calibration plots for predicting PFS in the validation model. (D) ROC curves of the nomogram for predicting PFS in the validation model.

