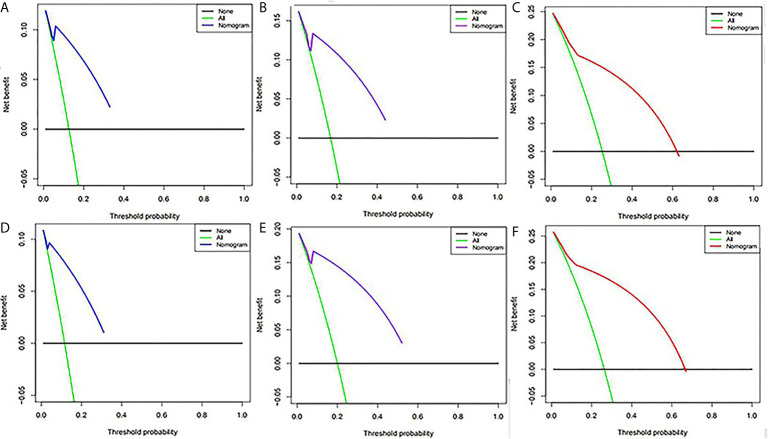
Figure 5.
Decision curve analysis of the nomogram for predicting PFS at 1-,(A) 2-,(B) and 5-year (C) points in the original model and PFS at 1-(D), 2-(E) and 5-year (F) points in the validation model. The percentage of threshold probability was represented by the x-axis, whereas the net benefit was represented by the y-axis, calculated by adding the true positives and subtracting the false positives.

