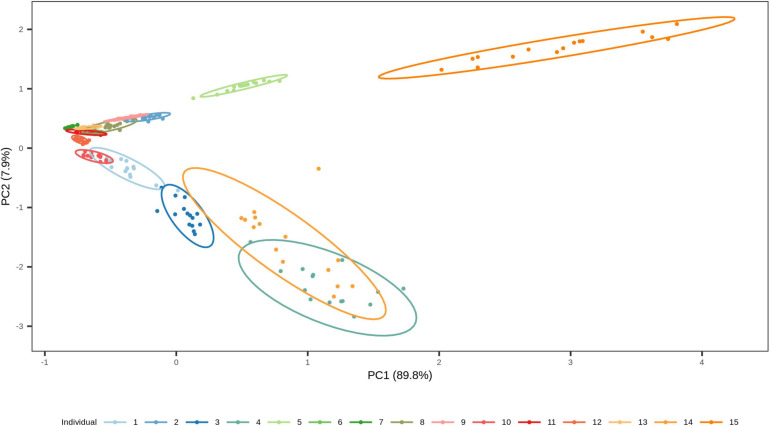
FIGURE 7.
Two-dimensional plot from principal component analysis (PCA) of the short-term dried saliva stains from 15 individuals. Projection of the counts of our four targeted species in the first two PCs together explains 97.7 % of the total variation. The stains cluster based on the individual, which highlights the high inter-individual variation in the data set.

