
FIGURE 4.
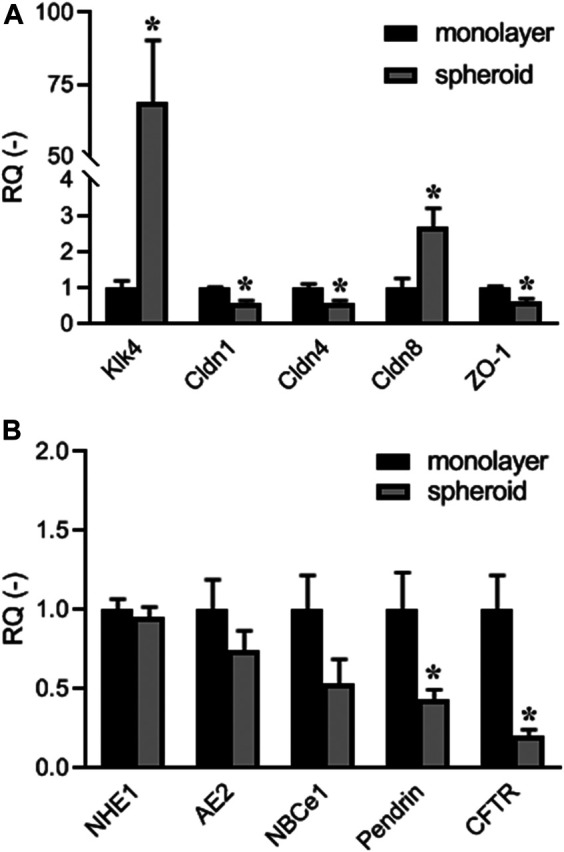
Quantitative RT-PCR data showing expression of: (A) maturation-phase ameloblast marker Klk4, and tight-junction protein genes Cldn1, Cldn4, Cldn8 (claudins 1, 4, and 8), and Tjp1 (ZO-1); (B) electrolyte transporter genes Slc9a1 (NHE1), Slc4a2 (AE2), Slc4a4 (NBCe1), Slc26a4 (pendrin), and Cftr (CFTR). Expression levels in HAT-7 cells grown in Matrigel with Hepato-STIM medium (spheroid) were normalised to expression levels in HAT-7 cells grown on Transwell permeable supports in differentiation medium (monolayer). Data are mean ± SEM. *p < 0.05 (n = 4).