Figure 1.
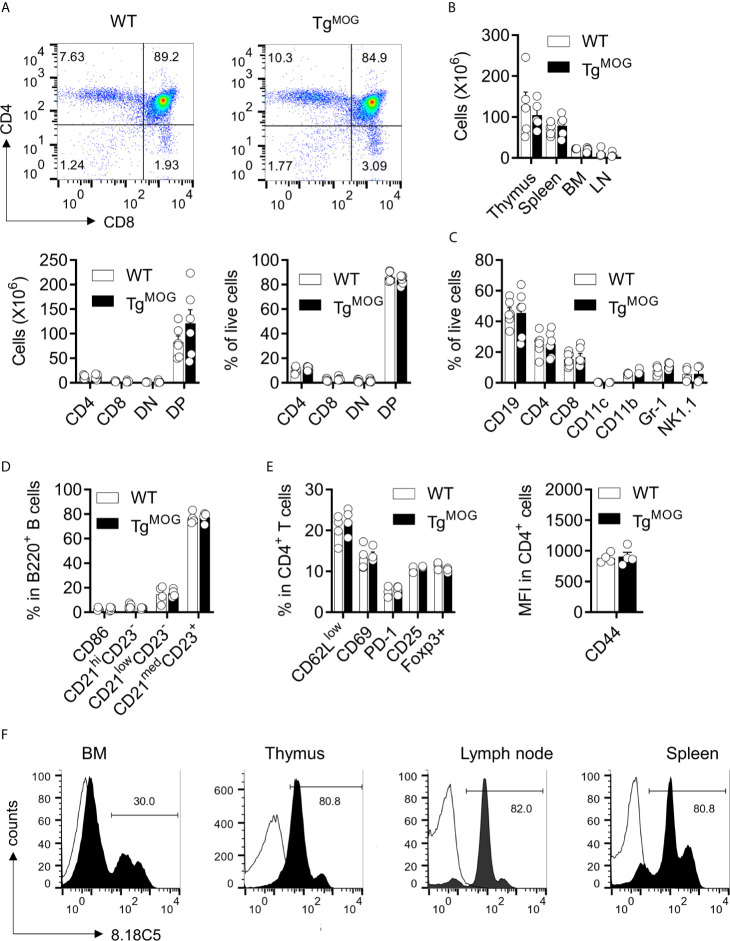
Lymphoid development in TgMOG mice. (A) Flow cytometry analysis of thymus from TgMOG and WT non-transgenic littermates. Representative plots are shown (top). Frequencies and total numbers of CD4+, CD8+, DN (CD4–CD8–), and DP (CD4+CD8+) T cells are depicted (bottom). (B) Cellularity of thymus, spleen, lymph nodes (LN), and bone marrow (BM). (C) Immune cell composition of the spleen from TgMOG and WT mice. Frequencies of CD19+, CD4+, CD8+, CD11c+, CD11b+, Gr-1+ and NK1.1+ cells in the live gate are shown. (D) B cell subsets in the spleen of TgMOG and WT mice. Frequencies of CD86+,CD21hiCD23–, CD21lowCD23–, CD21medCD23+ cells in gated B220+ cells are shown. (E) Activation marker expression in splenic CD4+ T cells. Frequencies of CD62Llow, CD69+, PD-1+, CD25+, Foxp3+ cells (left) or mean fluorescence intensity (MFI) of CD44 expression (right) in gated CD4+ cells are shown. (F) Representative flow cytometry histograms showing membrane MOG expression in lymphoid organs. (A–E) The combined data from two independent experiments is shown. n = 4 - 6 mice each group. Each circle represents an individual mouse.

