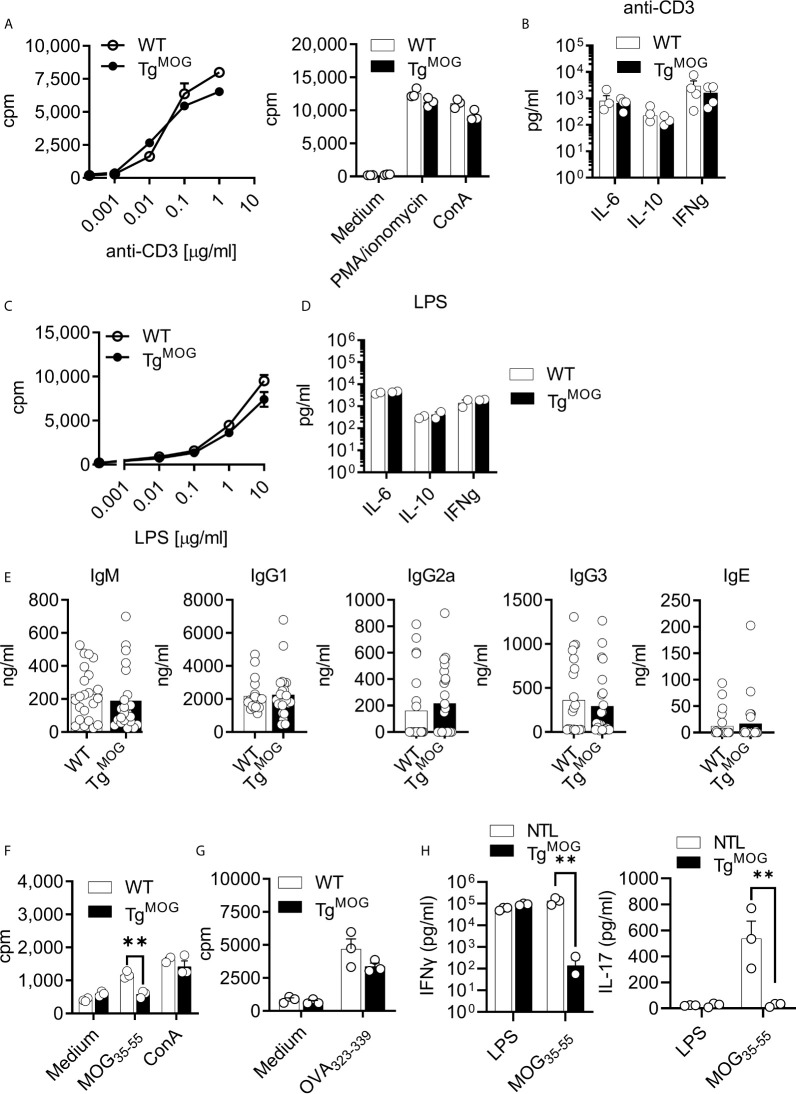
Figure 2.
Immune responses in TgMOG mice. (A), Proliferation of splenocytes from WT or TgMOG mice in response to polyclonal stimulants anti-CD3, PMA/ionomycin, and ConA. Each circle represents an individual replicate. (B), Cytokine (IL-6, IL-10, and IFNγ) secretion by splenocytes in response to anti-CD3 stimulation. Each circle represents an individual mouse. n = 4 per group. (C), Proliferation of splenocytes in response to LPS stimulation. (D), Cytokine (IL-6, IL-10, and IFNγ) secretion by splenocytes in response to LPS stimulation. Each circle represents an individual mouse. n = 2 per group. (E), Total IgM, IgG1, IgG2a, IgG3 and IgE immunoglobulin titers in the sera of TgMOG (n = 23) or WT (n = 22) mice were measured by ELISA. (F, G) Proliferation of splenocytes from MOG35-55 (F) or OVA323-339 (G) immunized WT or TgMOG mice. Each circle represents an individual replicate. **P = 0.0016 (Two-way ANOVA). (H), Cytokine (IFNγ and IL-17) secretion of splenocytes in response to LPS or MOG35-55 stimulation. **P = 0.0043, **P = 0.0094 (Two-way ANOVA). n = 3 per group. (A–D, F, G), Representative data from two independent experiments is shown.

