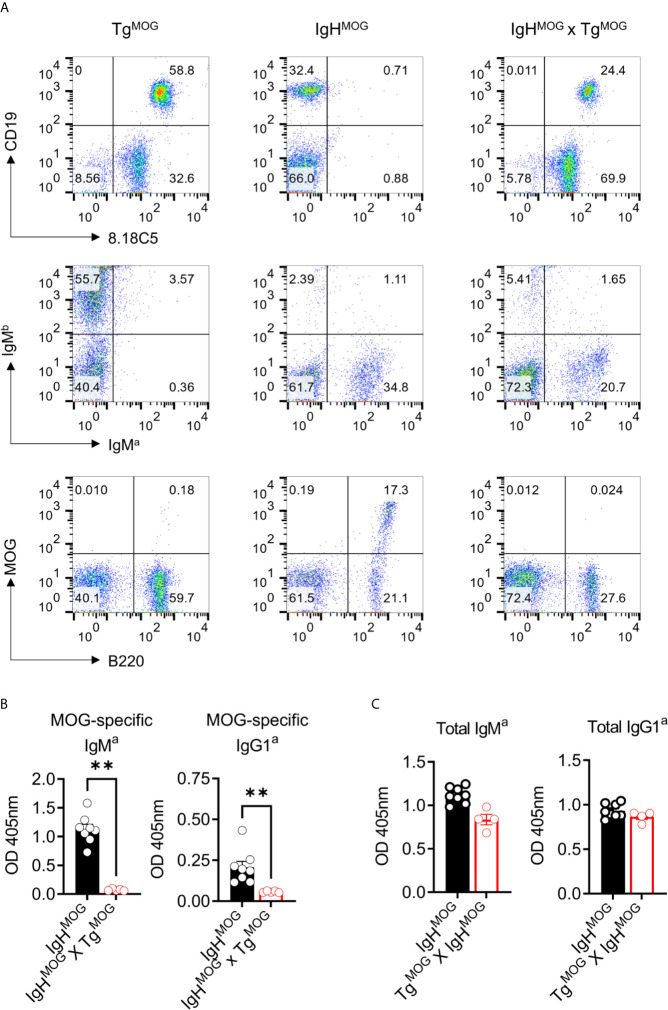
Figure 3.
MOG-specific B cells are deleted in IgHMOG X TgMOG mice. (A), Representative flow cytometry data from TgMOG, IgHMOG, IgHMOG X TgMOG mice. Cells were stained with antibodies against transgenic anti-IgMa, WT anti-IgMb, anti-MOG 8.18C5 antibodies or recombinant MOG protein along with B cell lineage markers B220 and CD19. Representative data from two independent experiments is shown. (B, C), MOG-specific (B), and total (C) IgMa and IgG1a antibodies in the sera were quantified by ELISA. Each circle represents an individual mouse. n = 5 – 8 mice per group. **P = 0.0016 (Mann-Whitney’s U-test, two-tailed).

