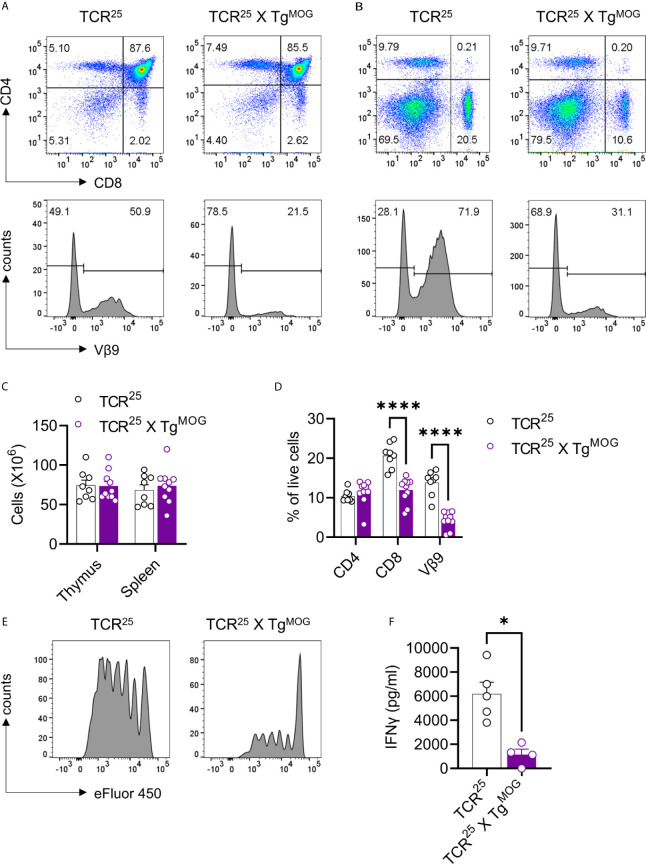
Figure 4.
Decreased MOG specific CD8+ T cells in TCR25 X TgMOG mice. (A, B), Flow cytometry analysis of thymus (A) and spleen (B) from TCR25 and TCR25 X TgMOG mice. The expression pattern of CD4 and CD8 is shown (upper panel). Lower panel histograms show transgenic Vβ9+ TCR on gated CD8 single-positive cells. Representative data from more than three independent experiments is shown. (C), Absolute numbers of immune cells from thymus and spleen. The combined data from two independent experiments is shown. Each circle represents an individual mouse. n = 8 – 10 per group. (D), Frequencies of CD4+, CD8+, and Vβ9+ T cell populations in the spleen of TCR25 and TCR25 X TgMOG mice. The combined data from two independent experiments is shown. Each circle represents an individual mouse. n = 8 – 10 per group ****P < 0.0001 (Two-way ANOVA). (E), Proliferation of CD8+ T cells from TCR25 or TCR25 X TgMOG mice in response to MOG206-214 (2 µg/ml). Histograms of cell proliferation dye e450 fluorescence on the gated CD8+ T cells are shown. Representative data from 2 experiments are shown. (F) IFNγ secretion by splenocytes in response to MOG206-214 (20 µg/ml). Each circle represents an individual mouse. n = 4 – 5 per group *P = 0.0159 (Mann-Whitney’s U-test, two-tailed).

