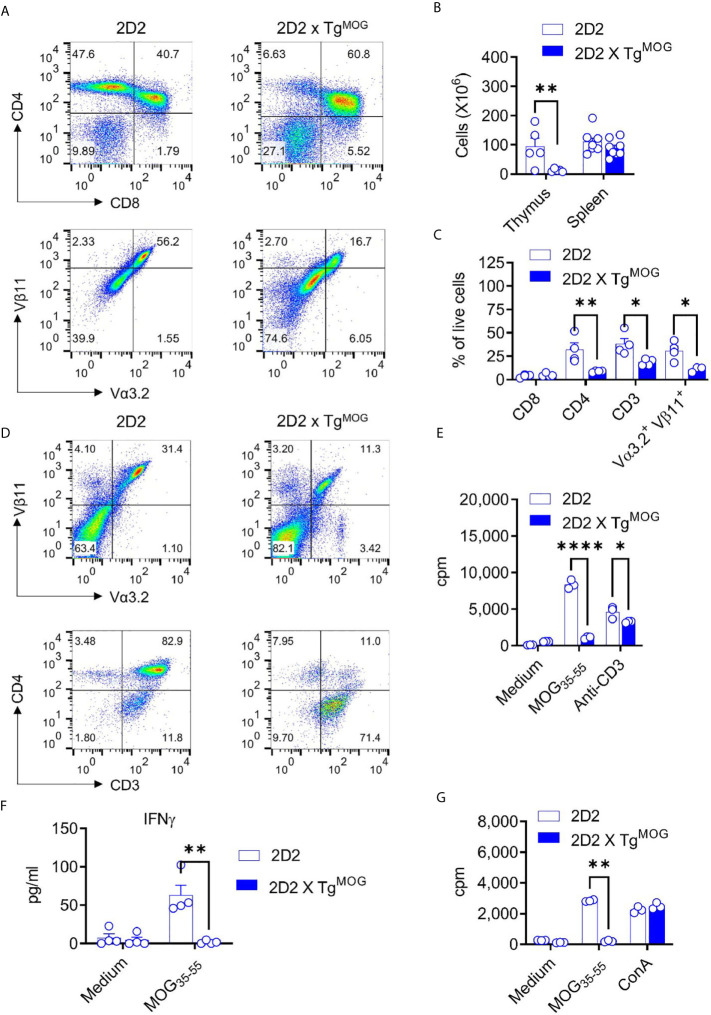
Figure 5.
MOG-specific CD4+ T cell - tolerance in 2D2 x TgMOG mice. (A), Flow cytometry analysis of thymus from 2D2 and 2D2 X TgMOG littermates. Representative plots are shown. (B), Cellularity of thymus and spleen from 2D2 and 2D2 X TgMOG littermates. The combined data from two independent experiments is shown. Each circle represents an individual mouse. n = 5 - 8 mice per group. **P = 0.0021 (Two-way ANOVA). (C), Immune cell composition of the spleen from 2D2 and 2D2 X TgMOG mice. Frequencies of CD4+, CD8+, CD3+, and transgenic TCR Vα3.2+Vβ11+ cells in the live gate are shown. Representative data from two independent experiments is shown. Each circle represents an individual mouse. n = 3 – 4 mice per group. **P = 0.0037, *P < 0.02 (Two-way ANOVA). (D), Analysis of CD4 and CD3 expression in transgenic TCR Vα3.2+Vβ11+ cells. Representative data from more than two independent experiments is shown. (E), Proliferation of splenocytes from 2D2 and 2D2 X TgMOG mice. Representative data from two independent experiments is shown. Each circle represents an individual replicate. ****P < 0.0001, *P = 0.0223 (Two-way ANOVA). (F), IFNγ secretion by splenocytes in response to MOG35-55. Representative data from two independent experiments is shown. Each circle represents an individual mouse. n = 4 per group. **P = 0.0026 (Two-way ANOVA). (G), Proliferation of splenocytes from MOG35-55 immunized 2D2 and 2D2 X TgMOG mice. Representative data from two independent experiments is shown. Each circle represents an individual replicate. **P = 0.0012, *P = 0.0348 (Two-way ANOVA).

