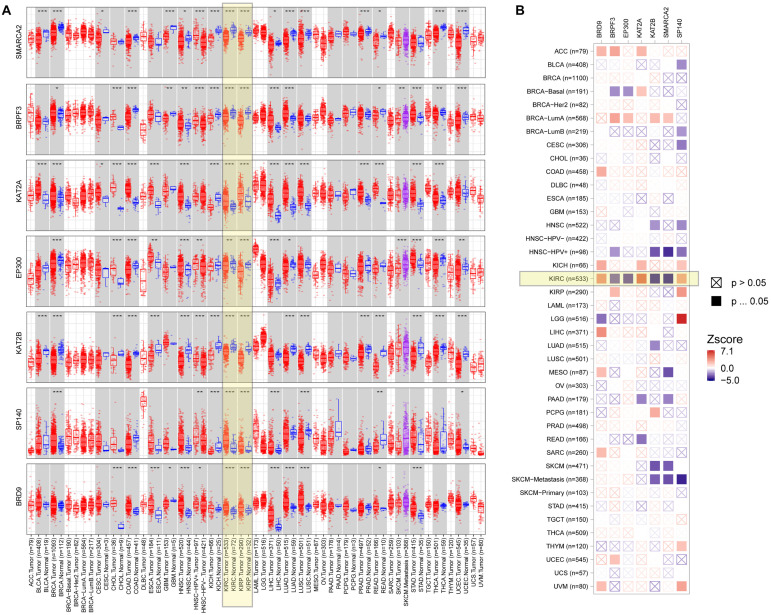
FIGURE 8.
Expression level and clinical relevance of the signature genes in different tumors. (A) The expression status of the signature genes in different cancers or specific cancer subtypes (*P < 0.05; **P < 0.01; ***P < 0.001). (B) Heatmap table of the normalized coefficients of the signature gene expression in the Cox proportional hazard model.

