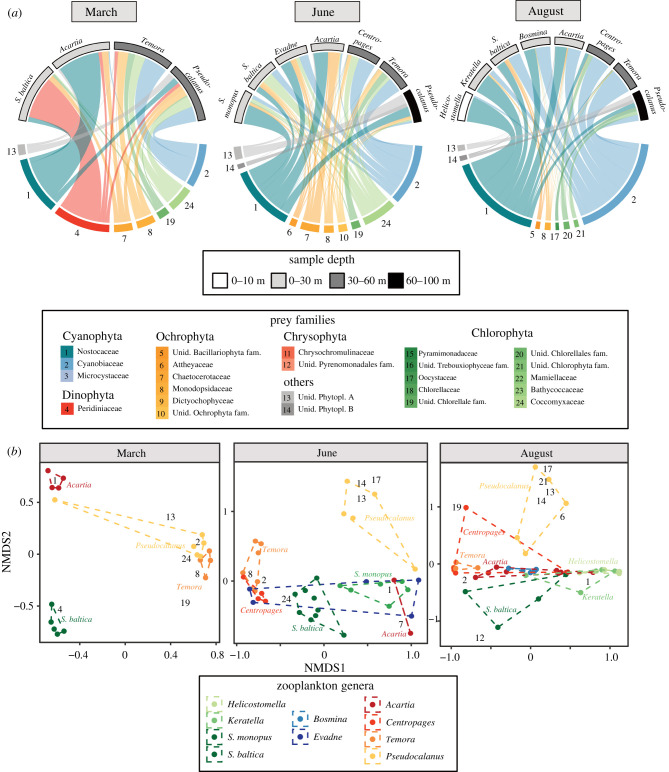
Figure 3.
(a) Zooplankton consumer species (upper) with their most prevalent prey families (lower) based on 16S rRNA gene reads. The thickness of the bars is proportional to relative rRNA read abundance. (b) Non-metric multidimensional scaling plot of Bray–Curtis distances between zooplankton samples (represented by coloured points) based on their prey (16S rRNA reads). The prey families responsible for the largest percentage of dissimilarity between any pair of zooplankton species are represented as numbers.

