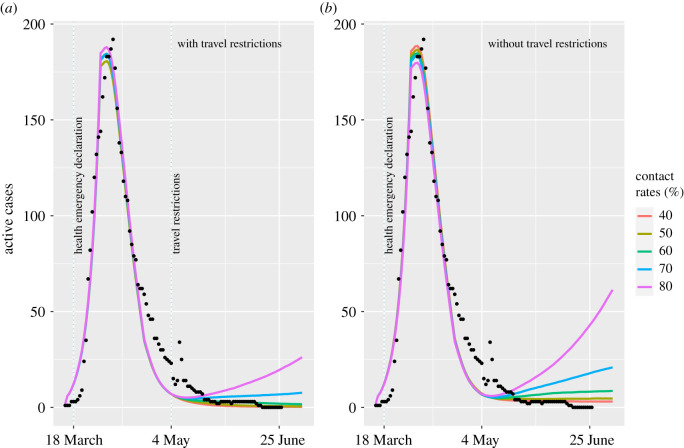
Figure 2.
The predicted mean number of active COVID-19 cases (lines) agrees well with the reported numbers of active COVID-19 cases in NL from 16 March to 26 June 2020 (dots) prior to the implementation of the travel restrictions on 4 May 2020. After 4 May 2020, we consider an alternative past scenario where no travel restrictions were implemented (b). Both with (a) and without (b) the travel restrictions, we consider different levels of physical distancing, represented as percentages of the daily contact rate at the pre-pandemic level (coloured lines). Each coloured line is the mean number of active clinical cases each day calculated from 1000 runs of the stochastic model, which considers variability in the timing and changes in the number of individuals with different COVID-19 infection statuses.

