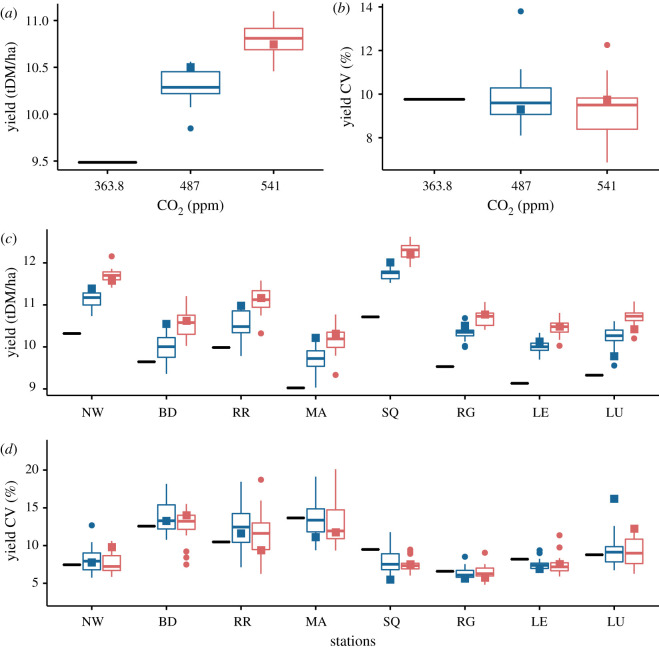
Figure 1.
Grain yield and its coefficient of variation. (a,b) Spatial averages over the 25 sites (table S2) of the mean simulated grain yield and its coefficient of variation (CV) for the baseline (black line) ([CO2] = 363.8 ppm) and the two 2050 scenarios RCP 4.5 ([CO2] = 487 ppm) and RCP 8.5 ([CO2] = 541 ppm) (respectively, blue and red box plots). (c,d) Site specific yield and CV at eight GB locations: NW (North Wykes), BD (Boscombe Down), RR (Rothamsted Research), MA (Marham), SQ (Saws Sennybridge), RG (Ringway), LE (Leeming), LU (Leuchars), (see map in electronic supplementary material, figure S1 and table S2 for details). Box plots are built out of the predictions for climate scenarios (each of which consists of 100 years of daily weather) derived using 19 individual GCMs from the CMIP ensemble phase 5. Box boundaries indicate the 25th and 75th percentiles, the line within the box marks the median, whiskers below and above the box indicate the 10th and 90th percentiles; dots correspond to outliers; squares specifically correspond to the predictions of the model HadGEM2-ES of the UK Meteorological Office. Simulations were performed for the wheat cultivar Mercia HD which is sensitive to heat and drought stress around flowering, and a single soil with medium available water content (AWC = 177), the sowing date being 20/10.

