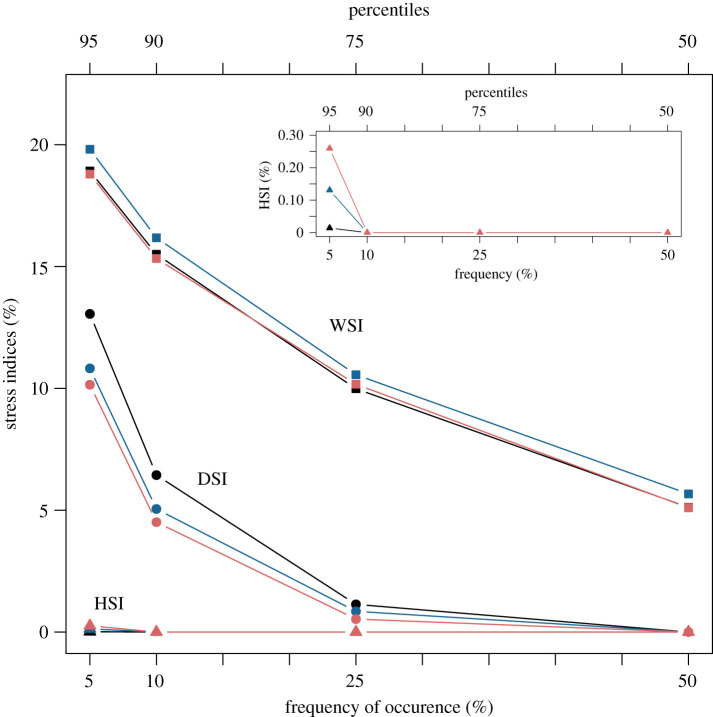
Figure 6.
Yield loss levels due to water stress versus frequency of occurrence. The frequencies correspond to the probabilities Prob(WSI > WSIpercentiles) associated with the 50, 75, 90, 95–percentiles of WSI. The data points represent the spatially averaged value of the medians of these four percentiles of WSI, as seen in the boxplots in figure 4. Projections for 2050 show that yield losses remain roughly the same compared to baseline. Nomenclature explained in figure 1. Cultivar: Mercia HD; Soil: Hafren (AWC = 177); Sowing date: 20/10.

