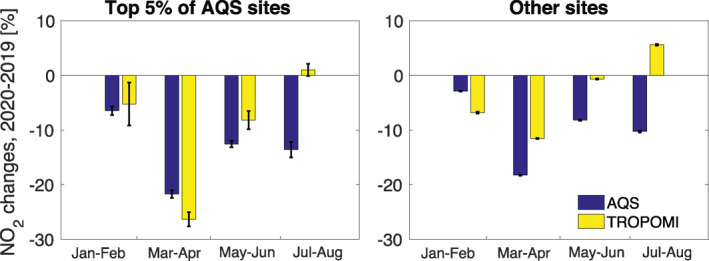
Figure 3.

Mean bimonthly changes in NO2 concentrations at AQS sites from 2019 to 2020. Changes in AQS surface air NO2 concentrations are compared to changes in TROPOMI tropospheric NO2 columns sampled at the same sites. Results for the AQS sites with the 5% highest 2019 NO2 concentrations on a 0.5° × 0.625° grid (Figure 1) are shown in the left panel. The effects of meteorological changes have been subtracted with a GEOS‐Chem simulation. The error bars represent the normalized standard errors of the changes averaged over the sites. AQS, Air Quality System; TROPOMI, Tropospheric Ozone Monitoring Instrument.
