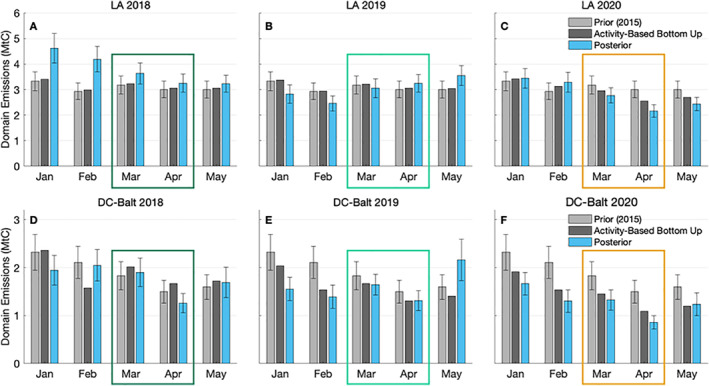
Figure 2.

Inversion posterior monthly mean fossil‐fuel CO2 (FFCO2) emissions estimates for January–May 2018, 2019, and 2020, along with the 2015 prior emissions estimate (Hestia‐LA: a–c; Vulcan: d–f) and an activity‐based bottom‐up (BU) estimate. Error bars on the posterior represent 95% confidence intervals. Uncertainties of the daily estimates are combined, accounting for correlations, to obtain overall uncertainties of the monthly means (Lawton, 2001). March and April are highlighted in each year with a colored rectangle. The error bars on the 2015 Hestia prior are 11% (Gurney et al., 2019) and for the 2015 Vulcan prior are 18% (Gurney et al., 2020).
