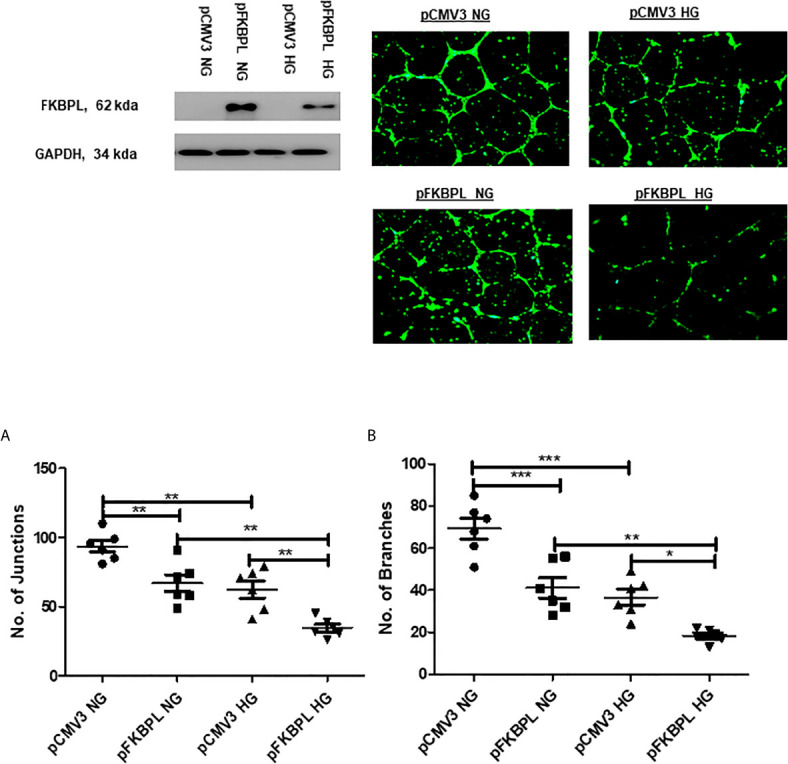
Figure 5.

Angiogenic potential is further reduced with FKBPL overexpression in high glucose conditions in HUVECs. The number of (A) junctions and (B) branches was quantified following FKBPL overexpression in HUVECs for 24 h. The cells were stained with calcein stain, before being plated in Matrigel and exposed to high glucose (HG, 30 mM) or normal glucose (NG, 5.5 mM) media for 24 h. Six images/well were taken using a DMi8 microscope; representative images are shown inset. Images were analysed based on the number of junctions and branches formed using ImageJ angiogenesis macros. (n=6, *<0.05, **<0.01, ***<0.001, One-way ANOVA, followed by Bonferroni multiple comparison test).
