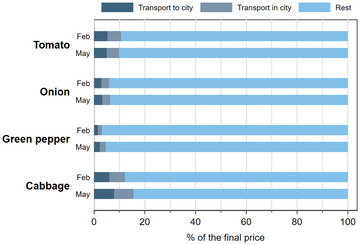
FIGURE 5.

Share of transportation costs in final retail price, by vegetable and survey round [Color figure can be viewed at wileyonlinelibrary.com]
Source: February 2020 and May 2020 survey rounds.

Share of transportation costs in final retail price, by vegetable and survey round [Color figure can be viewed at wileyonlinelibrary.com]
Source: February 2020 and May 2020 survey rounds.