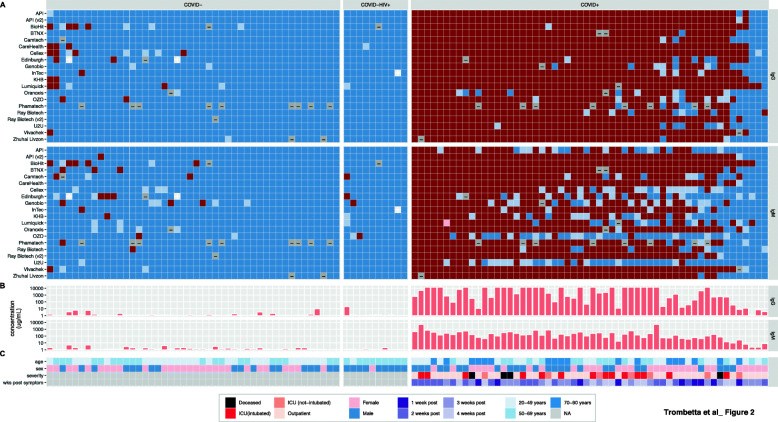
Fig. 2.
Per-individual LFA performance. Colors represent scores computed for IgG (top panel) and IgM (lower panel), where dark red = + 1 (operators all agree a band is present) and dark blue = −1 (operators all agree there is no band) with intermediate colors (pink and light blue) representing varying degrees of operator disagreement. Grey represents invalid runs. Samples are ordered within the COVID-, COVID-HIV+, and COVID+ groups in order of decreasing average score across all LFAs for both antibodies. Clinical variables include age (< 50 yrs.: light blue, 50-69 yrs.: intermediate blue, ≥70 yrs.: dark blue), sex (blue: male, pink: female), disease severity (hospitalized: light green, ICU: orange, ICU + respirator: red, deceased: black), and weeks post symptom-onset (dark green: 1–2 weeks, lightest green: ≥5 weeks)

