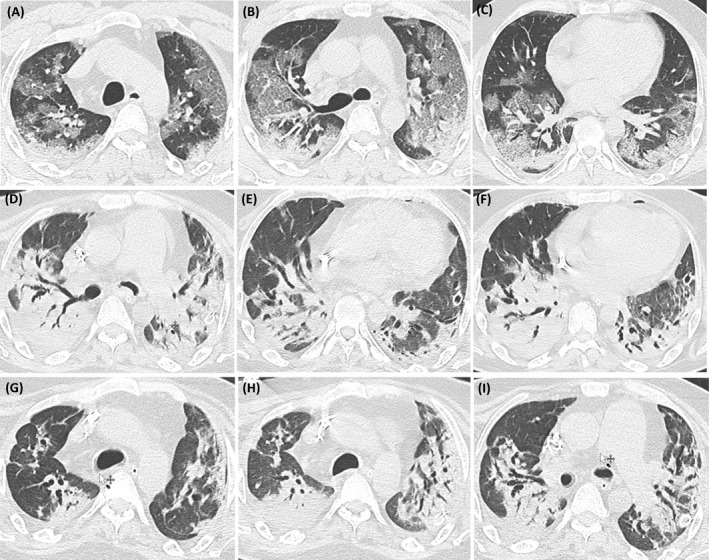
FIGURE 1.

Computed tomography (CT) of the chest during evolution: A, B, C: basal; D, E, F: 10 days of ECCO2R and G, H, I: 48 h of retirement of ECCO2R

Computed tomography (CT) of the chest during evolution: A, B, C: basal; D, E, F: 10 days of ECCO2R and G, H, I: 48 h of retirement of ECCO2R