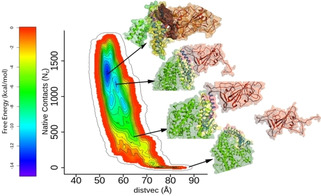
Figure 3.

Free Energy of hACE2‐RBD. binding Free energy surface of RBD (brown) binding to hACE2 (green) against two collective variables, native contact (Nc) and DISTVEC (Å). The structures along the path of dissociation are shown along the free energy bar diagram.
