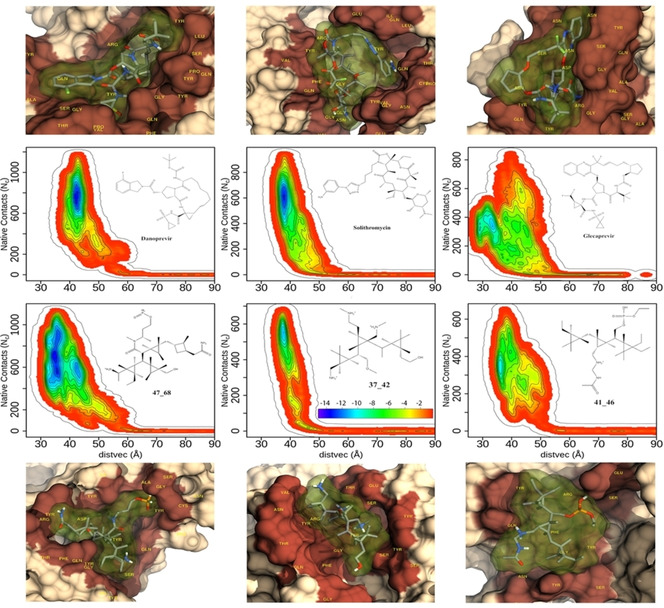
Figure 4.

Free energy surfaces (FES) of three best de novo molecules and three best repurposed drug molecules. The chemical structure and name of each molecule are shown in the inset. The free energy bar used to plot FES is shown in the inset of 37_42. The structures of the free energy minimum of each molecule, made using chimera, [32] are shown above/below the corresponding FES. The protein is drawn in surface representation while the drug is shown with both stick and surface (with 80% transparency). Note the deep cavity formed by each of these molecules in the protein.
