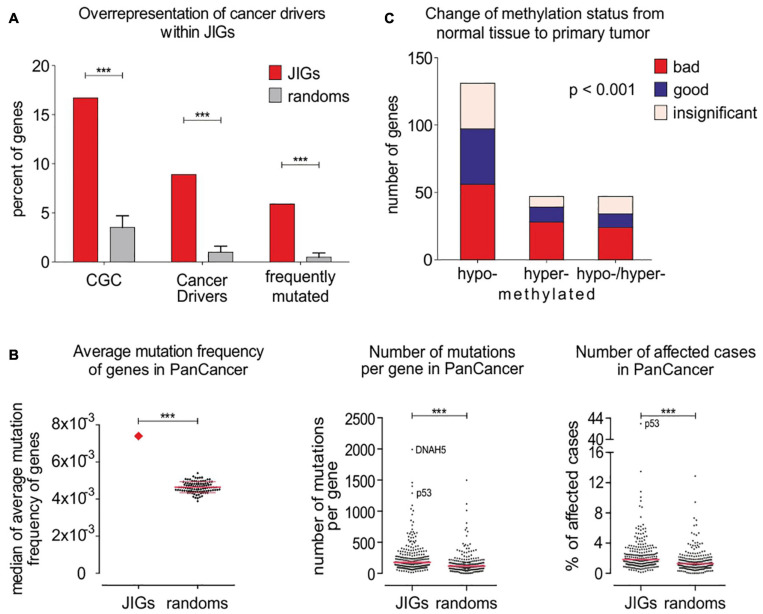
FIGURE 4.
JIGs undergo frequent gene mutations and epigenetic alterations across cancer types. (A) JIG enrichments in known and frequently mutated cancer drivers as indicated versus controls were 16.7% vs. 3.5 ± 1.2% (p < 0.001), (left); 8.9% vs. 1.0 ± 0.6% (p < 0.001), (middle); and 5.9% vs. 0.5 ± 0.4% (p < 0.001), (right).(B) The average mutation frequency of JIGs is higher in PanCan cohort versus genes of the random lists (left). This entails a higher number of mutations per individual JIG (center) and a higher number of patients exhibiting mutations in JIGs (right). Pink lines: medians. (C) Almost 74% (225/305) of JIGs undergo aberrant DNA methylation in 42 cancer types versus normal control tissues, whereby 131 are significantly hypomethylated, 47 are hypermethylated, and 47 are either hypomethylated or hypermethylated in a cancer type-dependent manner. Cox regression analysis on PanCan TCGA cohort data showed that more hypo- than hyper- methylated JIGs are correlated with either poor (“bad,” red color) or favorable (“good,” blue color) patient outcomes. Bars represent SEM.

