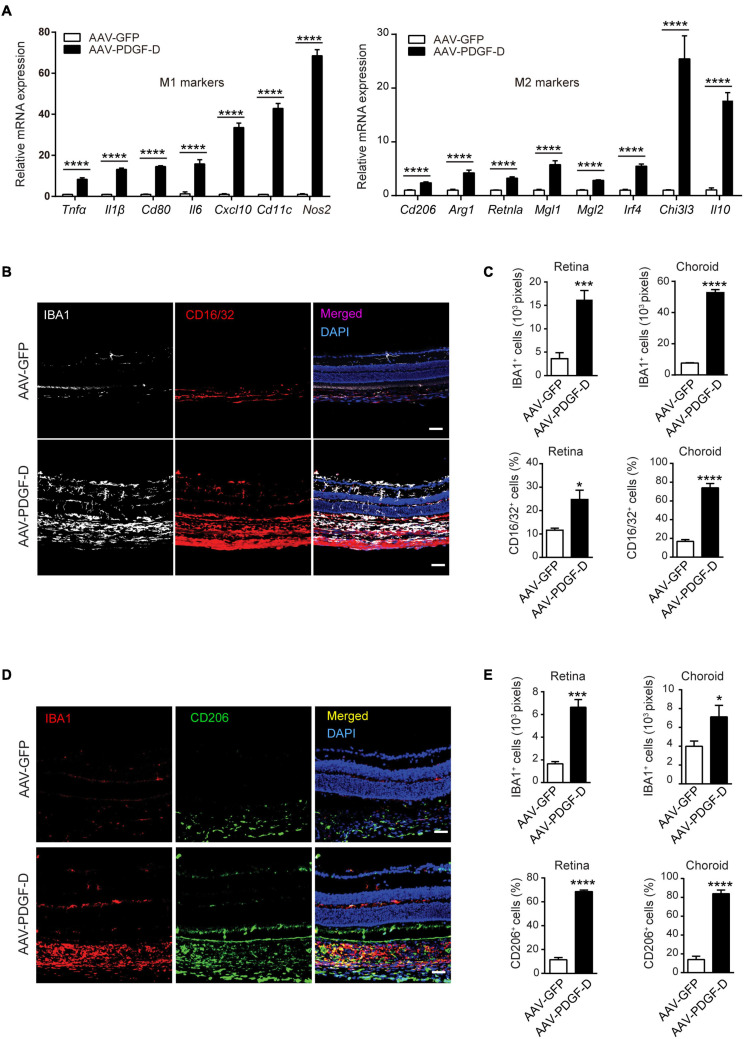
FIGURE 4.
PDGF-D induced macrophage polarizations. (A) Real-time PCR analysis of markers of M1 and M2 macrophage polarization regulated by PDGF-D in mouse retinal pigment epithelium. (B) Immunofluorescence staining for IBA1+ and CD16/32+ (M1 marker) cells in mouse retinae and choroids with AAV-GFP or AAV-PDGF-D injection. (C) Quantifications of IBA1+ and CD16/32+ macrophage densities in (B). (D) Immunofluorescence staining of IBA1+ and CD206+ (M2 marker) cells in mouse retinae and choroids with AAV-GFP or AAV-PDGF-D injection. (E) Quantification of CD206+ macrophage cell density in retinae and choroids in (D). Scale bar: 50 μm. n = 5, *p < 0.05, ***p < 0.001, ****p < 0.0001.

