FIGURE 8.

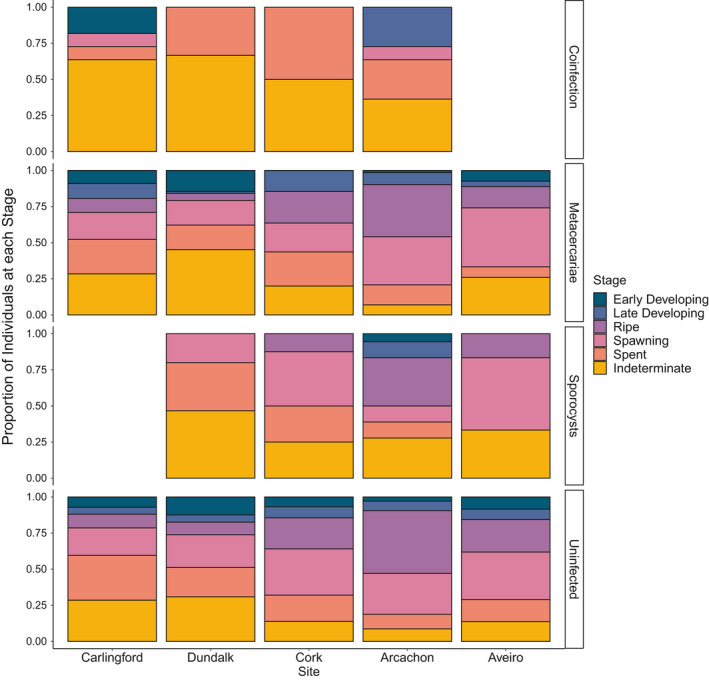
Proportion of C. edule at each stage of gametogenesis for individuals infected and uninfected by sporocysts and metacercariae. “Coinfection” indicates that an individual was coinfected by sporocysts and metacercariae

Proportion of C. edule at each stage of gametogenesis for individuals infected and uninfected by sporocysts and metacercariae. “Coinfection” indicates that an individual was coinfected by sporocysts and metacercariae