FIGURE 2.

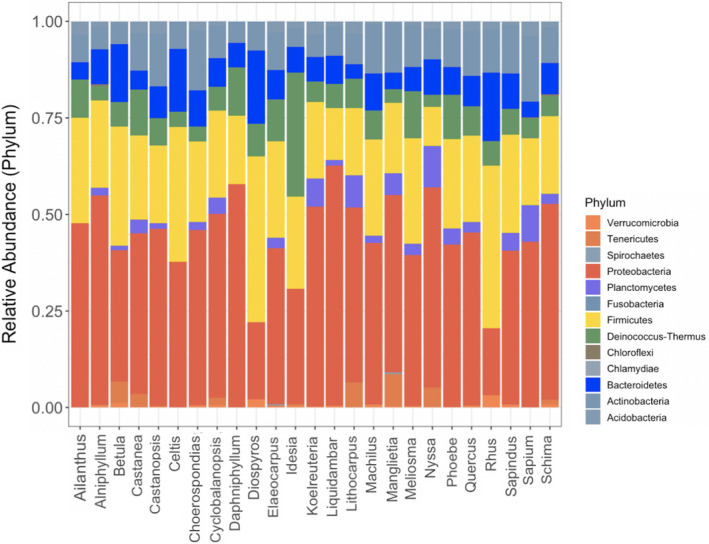
Bacterial phyla present in each tree genus, with relative abundances averaged across tree individuals of the same genus. The bacterial phyla are listed in the legend. Analysis is limited to phyla with site relative abundance >= 0.1%

Bacterial phyla present in each tree genus, with relative abundances averaged across tree individuals of the same genus. The bacterial phyla are listed in the legend. Analysis is limited to phyla with site relative abundance >= 0.1%