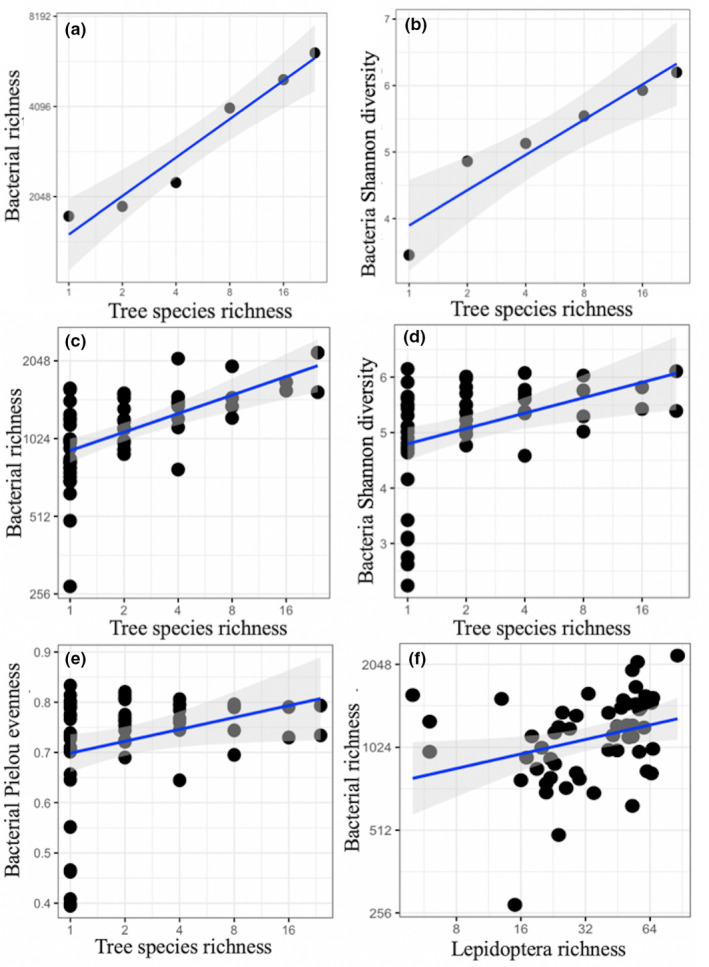
FIGURE 3.

Relationships between (a) tree species richness and bacterial richness, (b) tree species richness and bacterial Shannon diversity (at richness level), (c) tree species richness and observed bacterial richness, (d) tree species richness and bacterial Shannon diversity, (e) tree species richness and bacterial Pielou's evenness, (f) Lepidoptera richness and observed bacterial richness. Regression lines (with 95% confidence bands) show significant (p ≤ .05) relationships. The axis values are on a log‐scale for tree species richness, Lepidoptera richness and richness of bacteria. Note: Both of observed bacterial richness and estimated bacterial richness were positively correlated with tree species richness, only the former was shown here
