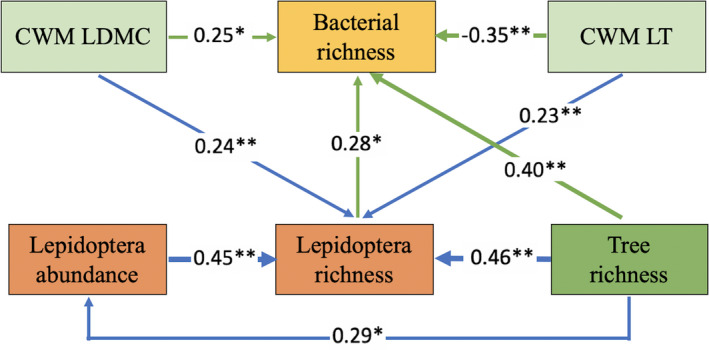
FIGURE 4.

Path model of the effects of tree species richness (direct effect and indirect effects through Lepidoptera abundance and Lepidoptera richness), Lepidoptera richness, CWM LT (direct effect and indirect effect through Lepidoptera richness), CWM LDMC (indirect effect through Lepidoptera richness) on richness of bacterial community. The path coefficients next to the arrows represent the strength of the positive or negative effects of one variable on another (**p < 0.001; *p < 0.05). See Table S1 and S3 for abbreviations and statistical values
