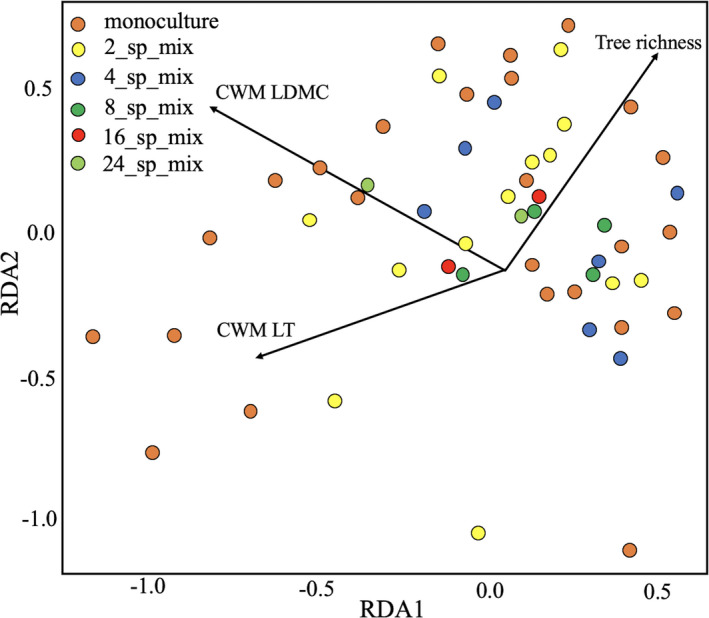
FIGURE 5.

Distance‐based redundancy analysis plot showing the relationships of CWM LDMC, CWM LT, and tree richness to the bacterial community structure. The plot represents db‐RDA analysis based on Bray–Curtis distance with all of the plot covariables and CWM of leaf traits as explanatory variables. CWM LDMC, CWM LT, and tree richness were three significant explanatory variables (p < .05)
