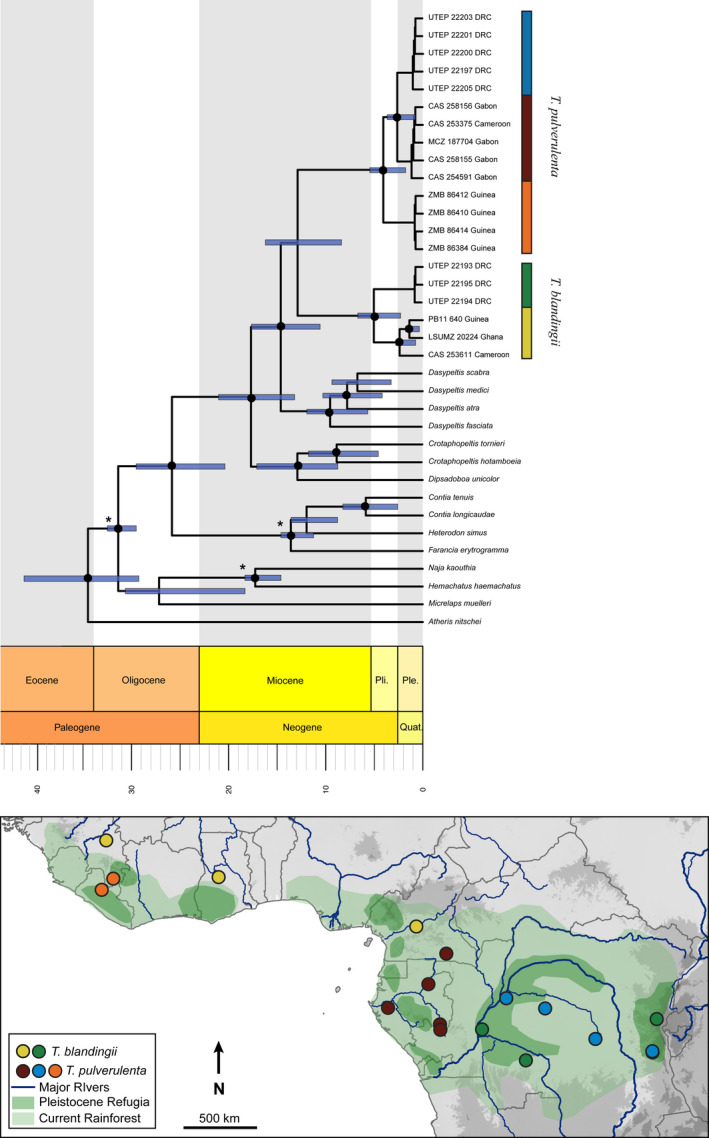
FIGURE 3.

Top: A time‐calibrated Bayesian phylogeny for Toxicodryas with c‐mos and cyt b genes. Highly supported nodes (PP ≥ 0.9) are denoted with a black circle. Fossil‐calibrated nodes are denoted with an asterisk. Node bars represent 95% confidence intervals. RADseq phylogenies showed identical topologies. Bottom: Toxicodryas clade distributions overlaid onto a map of elevation, major rivers and hypothesized rainforest refugia
