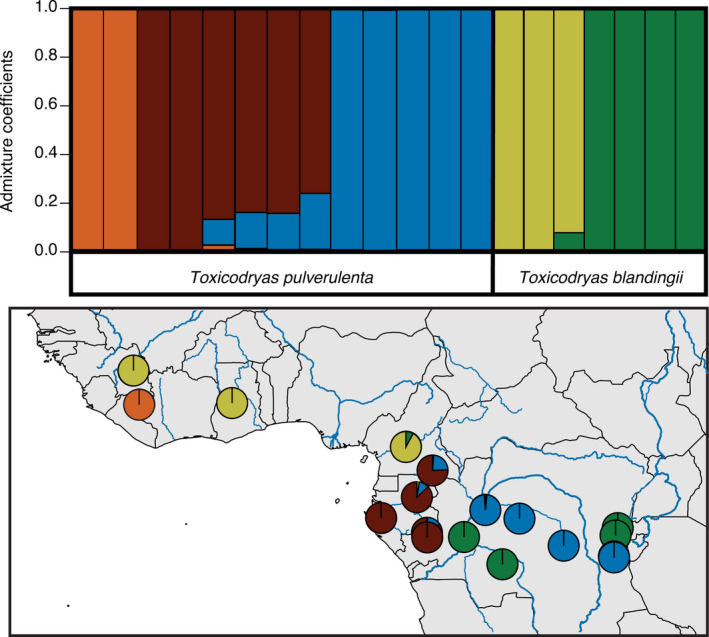
FIGURE 4.

Population structure of the genus Toxicodryas. Top: Bar plot of population structure and membership probabilities for K = 5 analyzed in LEA. Bottom: Geographic representation of population structure for K = 5 overlaid onto a map of major rivers
