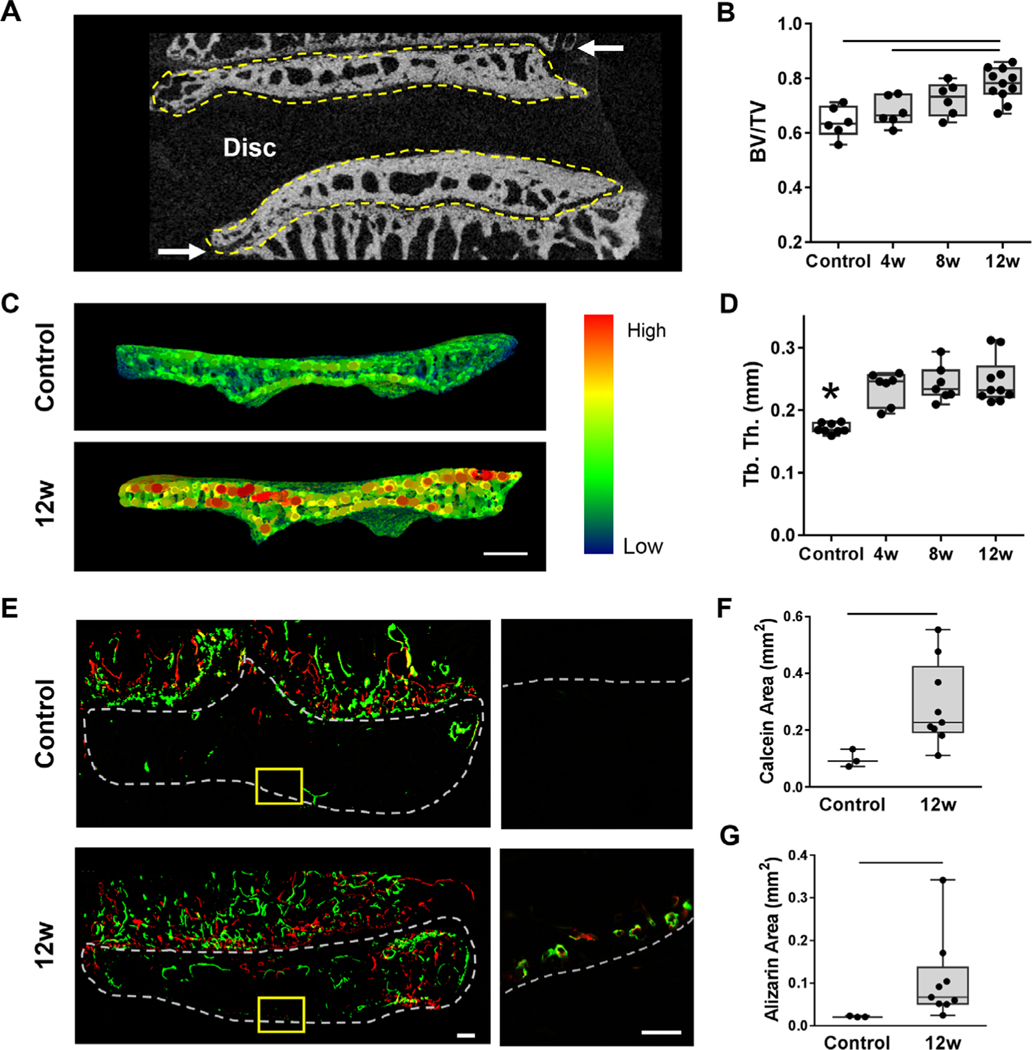
Fig. 2.
(A) Representative mid-coronal μCT slice of a control motion segment, with the cranial and caudal vertebral endplates outlined in yellow, denoting the volume of interest analyzed for bone morphometry. Arrows indicate the growth plates. (B) Quantification of bone volume/total volume (BV/TV) in the endplate regions for each group. (C) Representative trabecular thickness (Tb.Th) map of the endplate volume of interest and (D) corresponding quantification of Tb.Th of the endplates in each group. (E) Representative images of the bone fluorochrome labels (calcein = green, alizarin = red) in the endplate region. The dashed outline in the macroscale image denotes the endplate region between the disc and growth plate (scale bar = 100 μm). In the inset images (scale bar = 100 μm), the dashed line denotes the border between the NP and the endplate. (F) Quantification of calcein and alizarin areas in the control and 12-week punctured groups. Bars denote statistical significance (BV/TV = control-12 weeks, p = 0.0004; 4–12 weeks, p = 0.01; Tb.Th = control-4 weeks, p = 0.0006; control-8 weeks, p = 0.0002; control-12 weeks, p < 0.0001, ANOVA). Calcein: p = 0.01; alizarin: p = 0.009, Mann–Whitney test.

