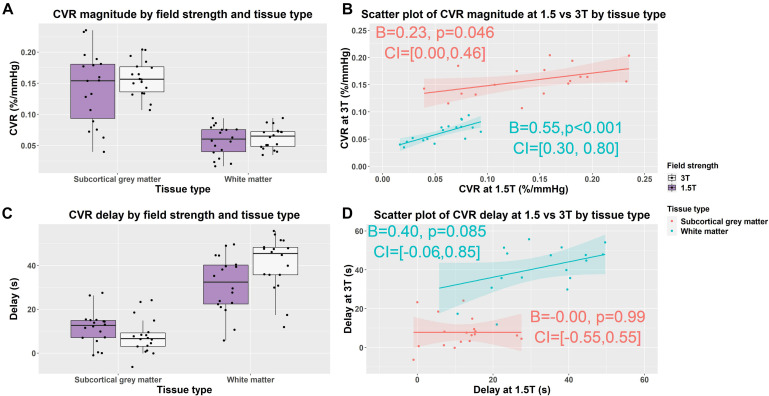
FIGURE 3.
Box (A,C) and scatterplots (B,D) of mean cerebrovascular reactivity (CVR) magnitude and delay values in subcortical gray and white matter at 1.5 and 3T. Lines of best fit for the subcortical gray/white matter CVR magnitude and delay are shown separately in pink/blue. (B = effect size, CI = confidence interval, p-values uncorrected for multiple comparisons).

