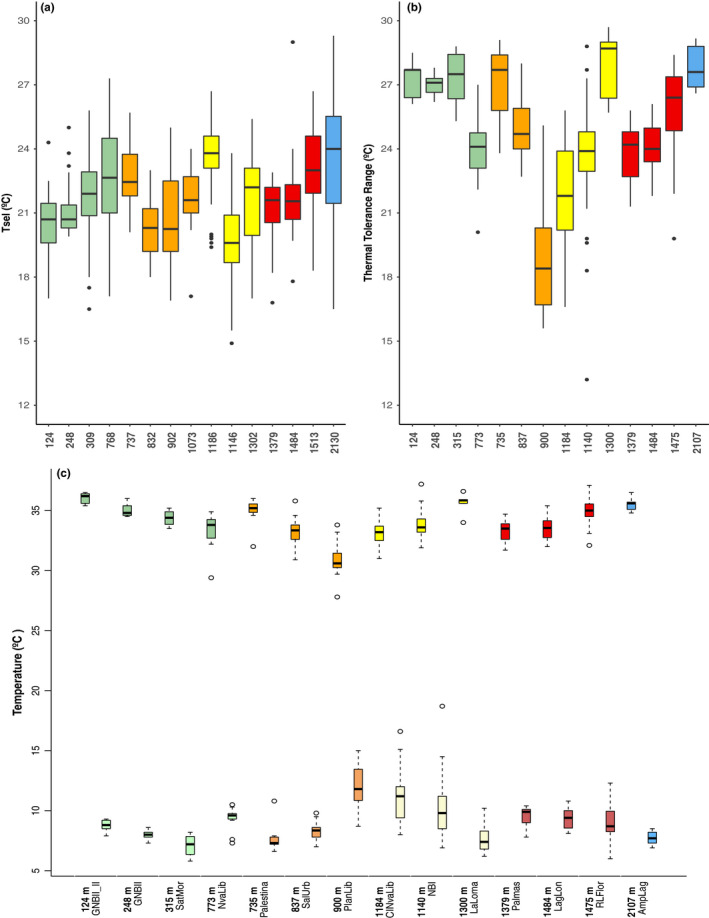
FIGURE 3.

(a) Preferred temperature (Tsel) and (b) Thermal tolerance range (TTR) of populations sampled along the elevational gradient and bioclimatic domain (colors). The x‐axis represents the elevation in meters above sea level. (c) Relationship between thermal tolerance limits in different elevations and bioclimatic domains. (CTmax: top) and (CTmin: bottom). The x‐axis represents the elevation in meters and the name of population sampled
