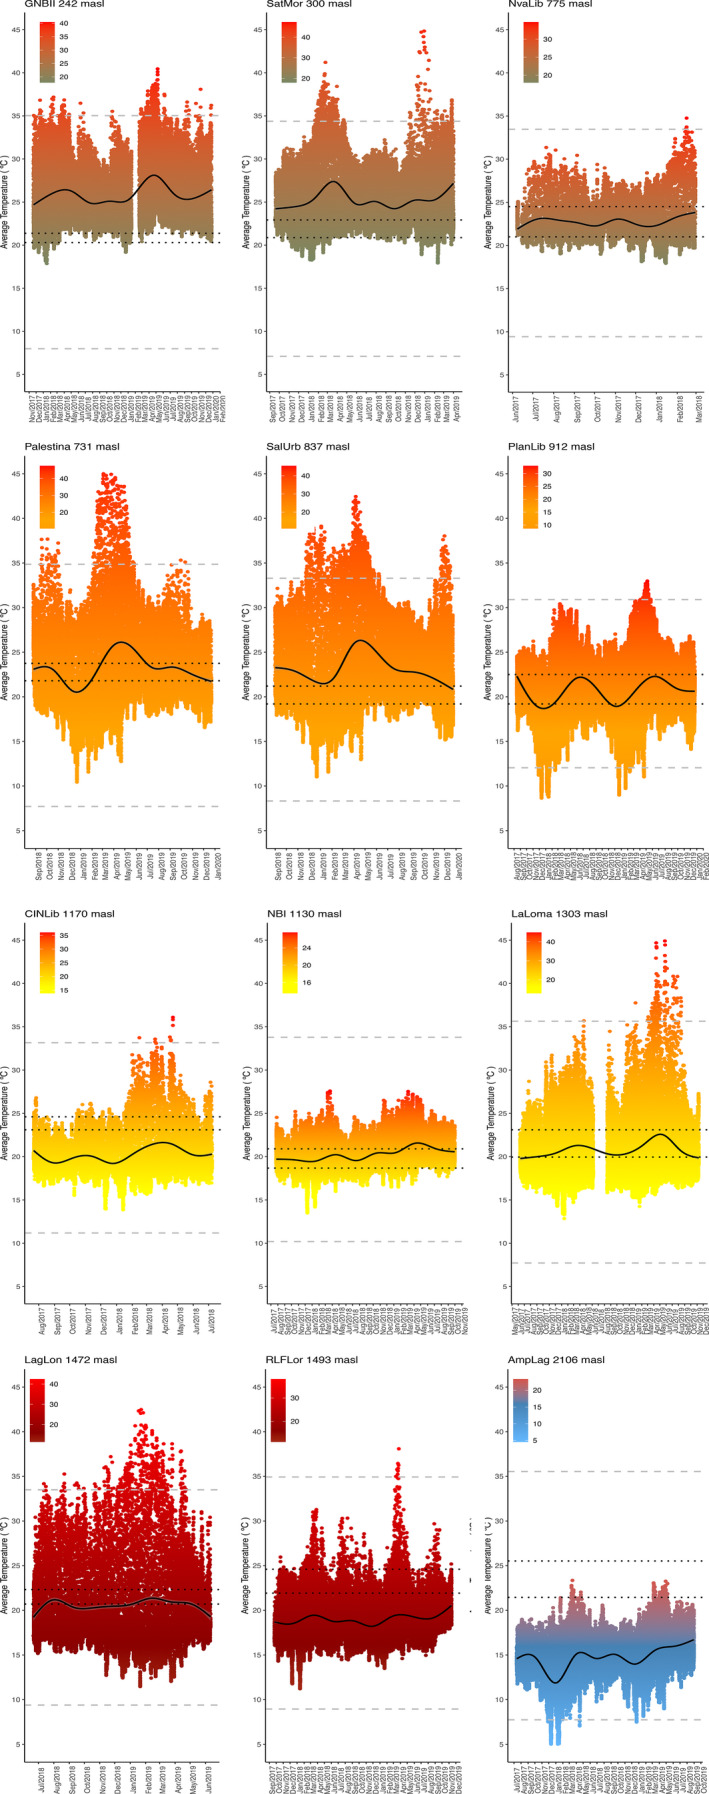
FIGURE 4.

Microclimate temperatures (mean daily) and thermal limits of sampling localities between June 2017 and December 2019 at the five bioclimatic domains. Gray dashed lines represent the upper and lower thermal limits (CTmax and CTmin), respectively. Black dotted lines are the intervals of the Tsel, and the bold line represents mean temperature
