
FIGURE 3.
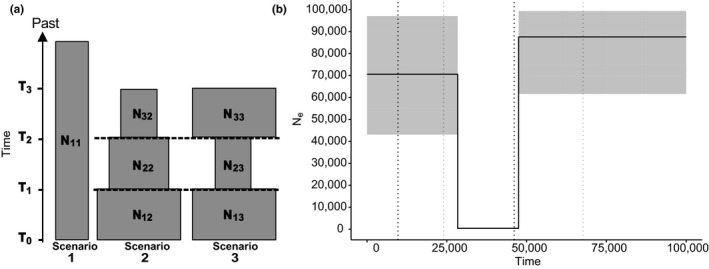
(a) Scheme of three demographic scenarios tested with DIYABC representing the following hypothesis. Scenario 1: constant effective population size, scenario 2: progressive and constant population expansion, and scenario 3: a bottleneck event followed by a recent population expansion (see Table S2 for parameter prior values). Effective population sizes are represented by N, the first subscript represents order in time, and the second represents the scenario in which the parameter was used (i.e., corresponds to the most recent effective population in scenario 1). Time was represented as t with higher values corresponding to events further in the past. (b) Scaled representation of the results from the best scenario (3) obtained from DIYABC analysis. Black solid line represents the mean effective population size through time in years. Shaded area represents 95% confidence intervals for . Dotted lines indicate 95% confidence intervals for time: black dotted line for the most recent event (expansion) and light gray dotted line for a previous event (bottleneck)