FIGURE 5.

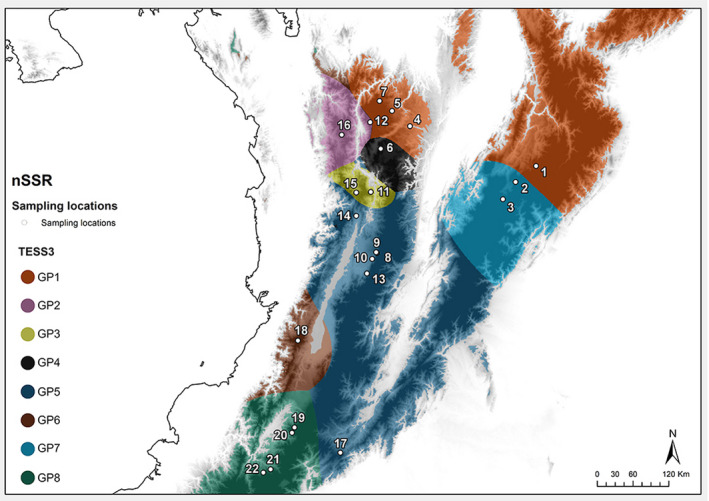
Distribution of genetic clusters calculated by tess3r (background coloration) from nSSR. Elevation is represented by a grayscale of light colors for lowlands and dark colors for highlands

Distribution of genetic clusters calculated by tess3r (background coloration) from nSSR. Elevation is represented by a grayscale of light colors for lowlands and dark colors for highlands